Check out the conversation on Apple, Spotify and YouTube.
Brought to you by:
Maven: Get 15% off Caitlin’s courses with code AAKASHxMAVEN
Pendo: The #1 software experience management platform
Kameleoon: AI experimentation platform
Amplitude: The market-leader in product analytics
Today’s Episode
Discovery might be the most important core PM skill for building great products.
But most PMs are unprepared to do discovery in AI. PMs run surveys incorrectly, conduct interviews poorly, and end up with poor insights.
Today will give you the roadmap to avoid all those mistakes.
Caitlin Sullivan is a user research expert who runs courses teaching PMs how to do AI-powered discovery. And in today’s episode, she shows you exactly how she does it.
We’re talking live demos. Step-by-step workflows. Real survey data. Real interview transcripts.
This is a masterclass in discovery. The kind that moves the needle.
Your Newsletter Subscriber Bonus
As a thank you for having me in your inbox, I’ve written up a complete guide to building your AI native PM operating system. It’s the ultimate composable stack playbook:
Today’s guide covers:
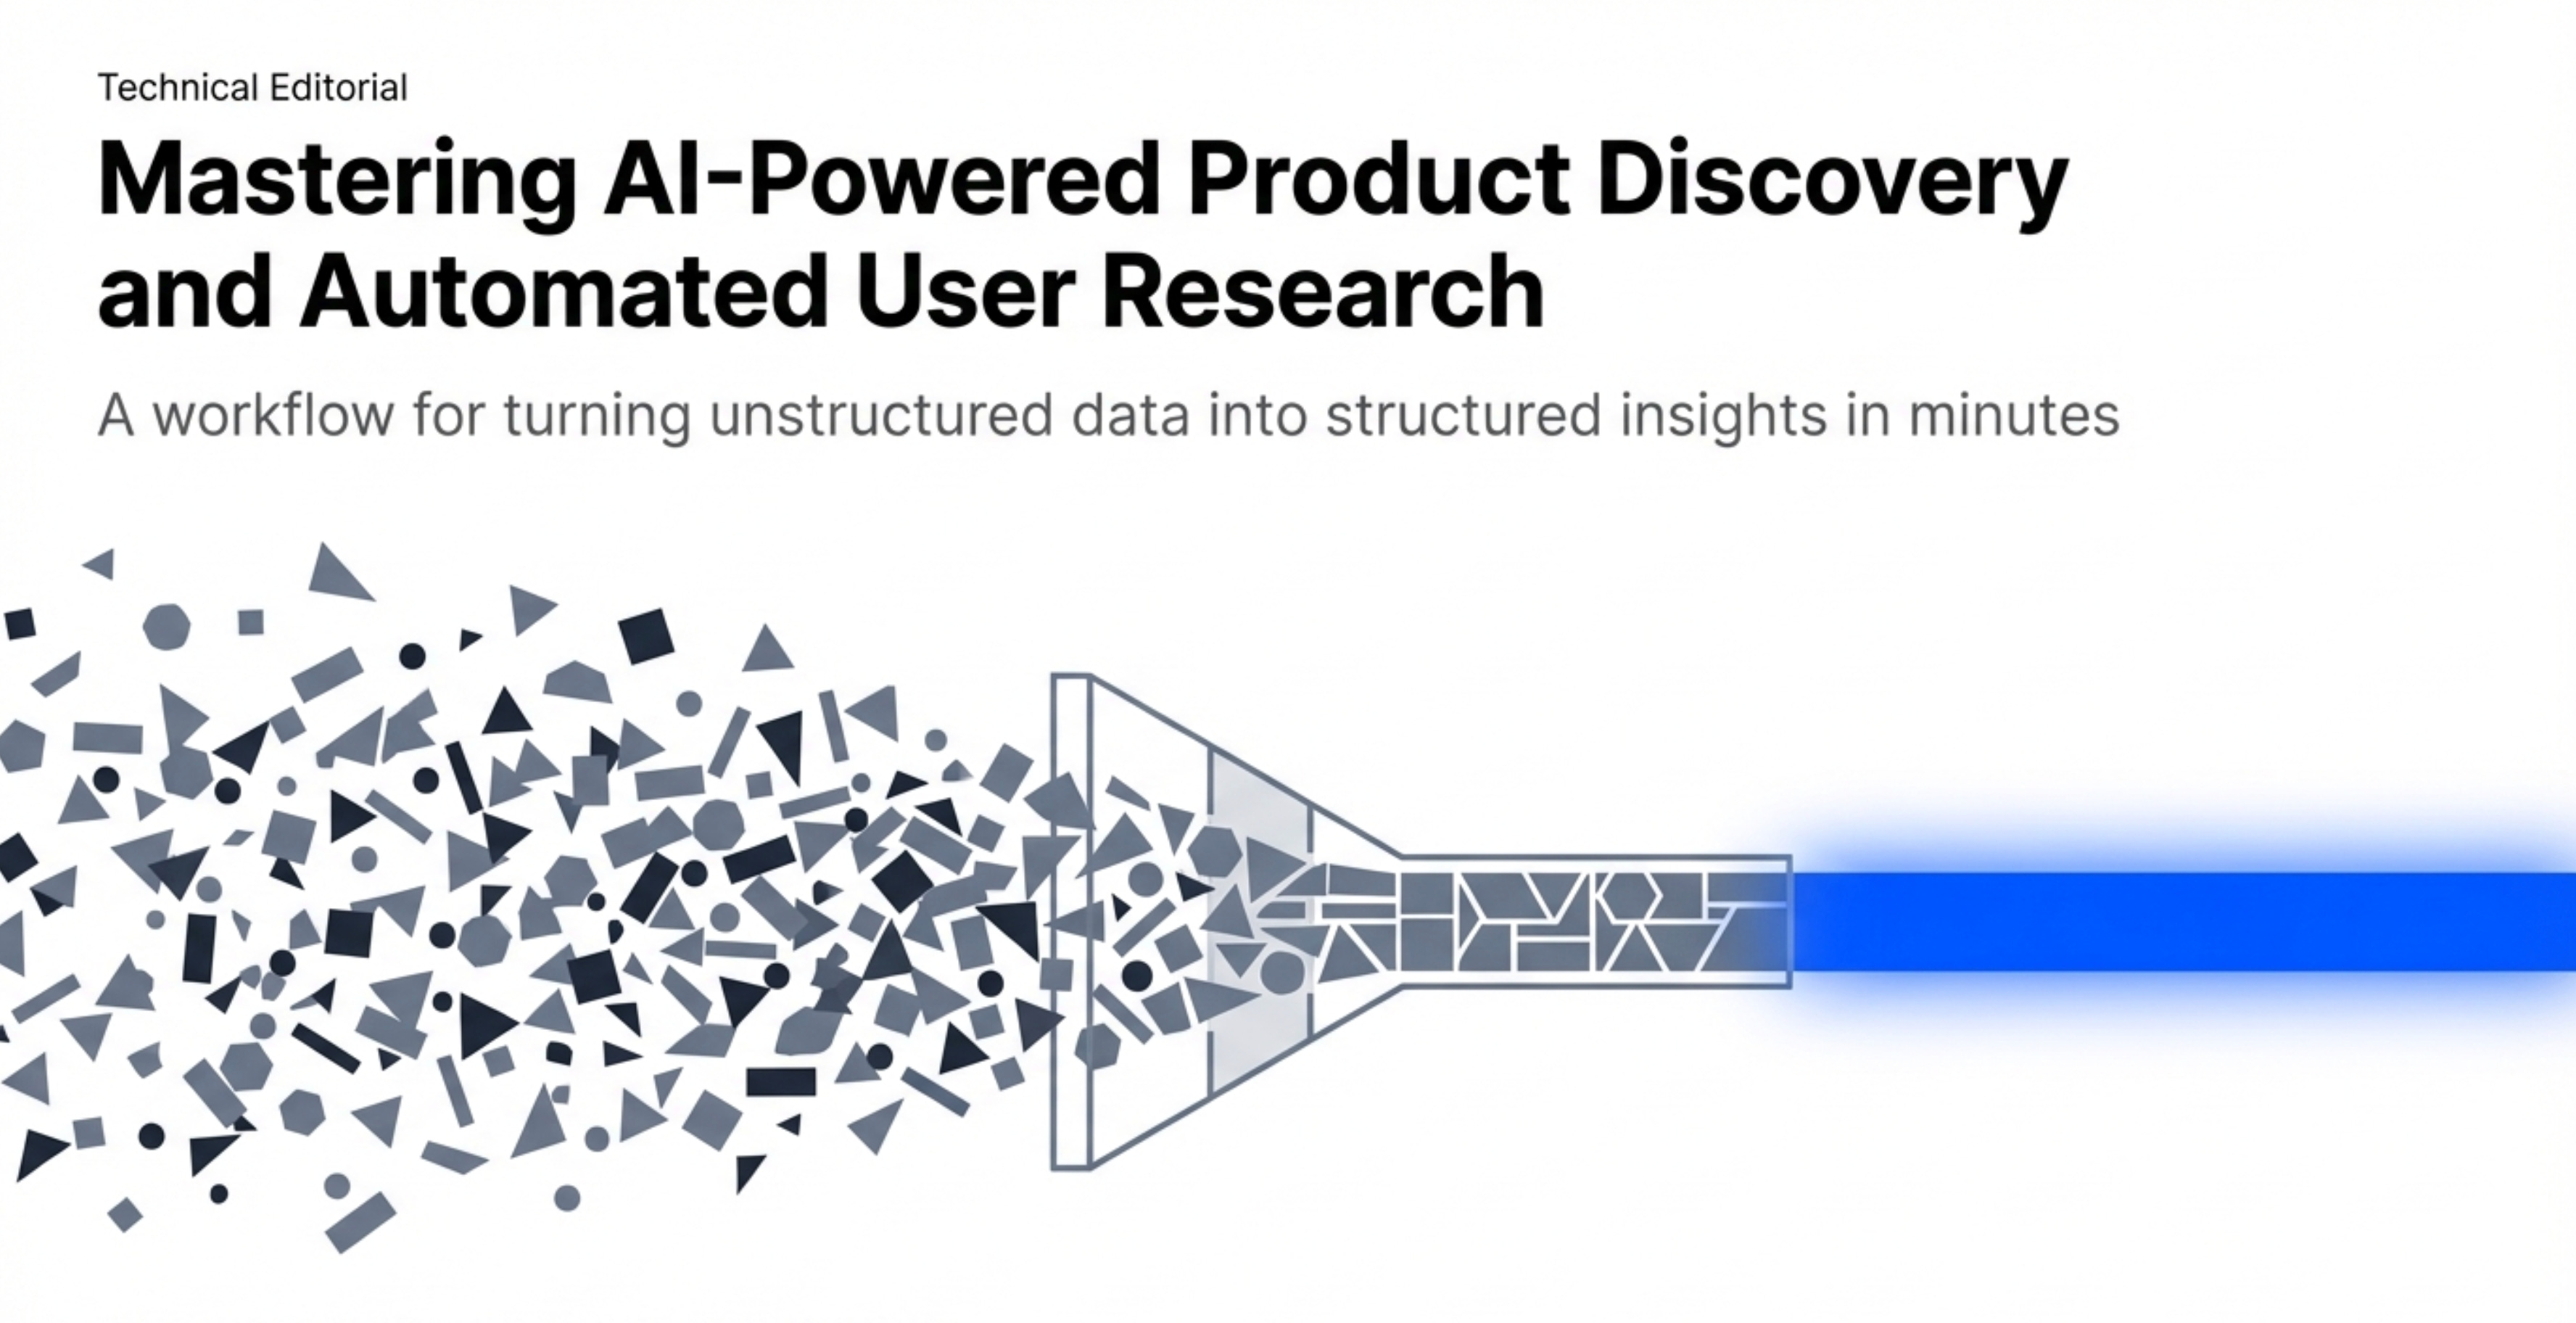
Why AI Changes Discovery Completely
The Step-by-Step Survey Analysis Workflow
The Step-by-Step Interview Analysis Workflow
How to Build Discovery Agents with Claude Code
Advanced Techniques for Production-Grade Analysis
1. Why AI Changes Discovery Completely
Most PMs treat discovery as a checkbox.
Run some user interviews. Send out a survey. Check the box. Move on to building.
The problem is the analysis never actually happens.
You end up with:
Survey responses sitting in a spreadsheet
Interview recordings you never transcribe
Notes scattered across documents
Zero actionable insights
I’ve seen this pattern on every product team I’ve worked with.
The issue isn’t that PMs don’t care about discovery. It’s that traditional discovery takes too much time.
A proper interview analysis used to require:
Transcribing the recording (30+ minutes per interview)
Reading through the entire transcript
Extracting key themes and quotes
Organizing findings by topic
Synthesizing across multiple interviews
For a standard discovery sprint with 10 interviews, that’s 10+ hours of analysis work.
Most PMs don’t have 10+ hours. So the analysis doesn’t happen.
AI Solves the Time Problem
With AI, the same analysis takes minutes instead of hours. (If you haven't set up your AI stack yet, start with my bundle.)
Here’s what the workflow looks like for analyzing a single interview:
Upload transcript to Claude
Run structured analysis prompt
Get organized findings with timestamps
Export to markdown file
Total time: 3-5 minutes per interview.
For 10 interviews, that’s 30-50 minutes instead of 10+ hours.
This changes the economics of discovery completely.
When analysis takes 10 hours, you only do it for the most critical projects. When analysis takes 30 minutes, you can do it for everything.
The Three Discovery Use Cases
AI-powered discovery works for three main scenarios:
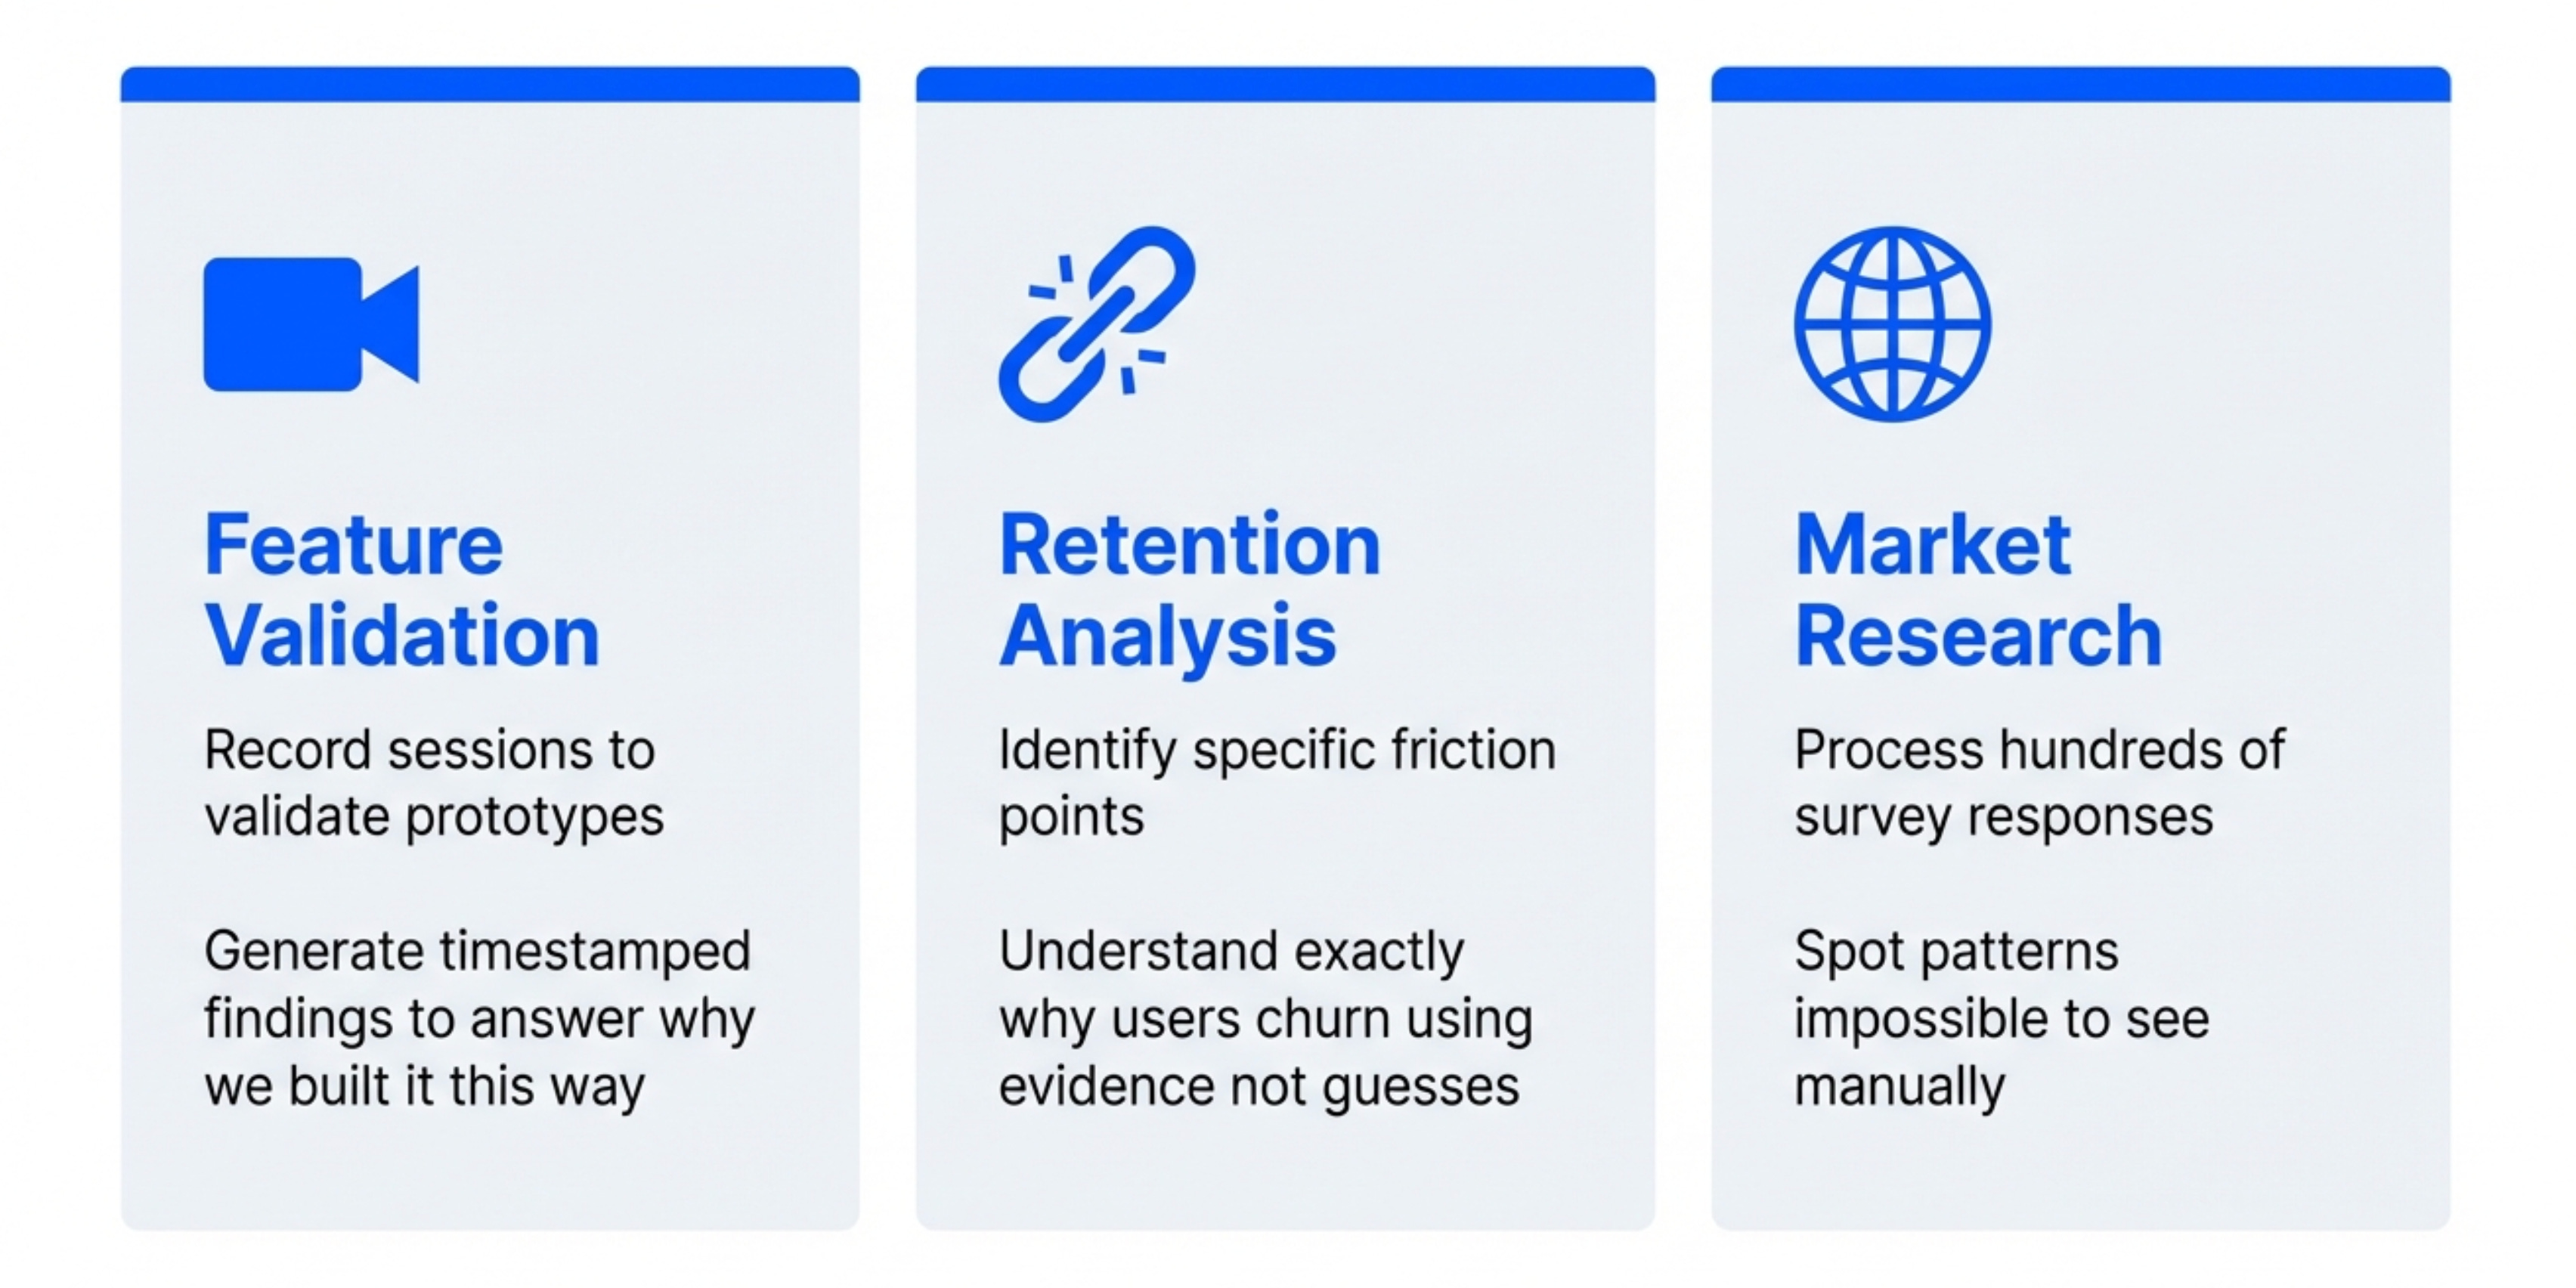
Use Case 1 - Feature Validation
You’ve built a prototype. You need to validate it with users before investing engineering time.
Traditional approach: Run 5-10 user tests, take notes, report findings verbally to the team.
AI approach: Record every session, get transcripts analyzed automatically, share structured findings document with timestamps.
The difference is you actually have data to reference later. When someone asks “why did we build it this way?” you have timestamped quotes to point to.
Use Case 2 - Retention Analysis
Your product has a retention problem. You need to understand why users churn.
Traditional approach: Look at analytics, make guesses about why people leave.
AI approach: Interview churned users, analyze transcripts for patterns, identify specific friction points with evidence.
In the episode, we walked through this exact process using interviews with meditation app users to understand retention drivers.
The output included:
Value anchors (what users care about most)
Friction points (where the experience breaks down)
Competitive gaps (what alternatives provide that you don’t)
Risk segments (which user groups are likely to churn)
All with timestamped evidence from actual user conversations.
Use Case 3 - Market Research
You’re exploring a new product area. You need to understand user needs and competitive landscape.
Traditional approach: Read competitor websites, run a few interviews, make educated guesses.
AI approach: Systematic survey analysis, interview synthesis, competitive analysis with structured outputs.
This is where AI really shines. You can process hundreds of survey responses and dozens of interviews to find patterns that would be impossible to spot manually.
The key insight is that AI doesn’t replace the need for good discovery questions. It just removes the friction from analysis.
You still need to know your users. You still need to ask good questions. But now you can actually act on what you learn.
2. The Step-by-Step Survey Analysis Workflow
Let’s get tactical.
Setup
You’ve just finished a survey. You have responses in a spreadsheet.
For the demo, Caitlin used a meditation app retention survey with these questions:
How long have you been using the app?
What made you start using it?
What keeps you coming back?
What would make you stop using it?
Have you considered alternatives?
Standard retention research questions. Nothing fancy.
The key is how you analyze the responses.
Step 1 - Export Your Data
Get your survey data into a clean format.
Google Forms automatically exports to Sheets. Typeform exports to CSV. Whatever tool you use, get a clean spreadsheet with:
One row per response
One column per question
Timestamps if you have them
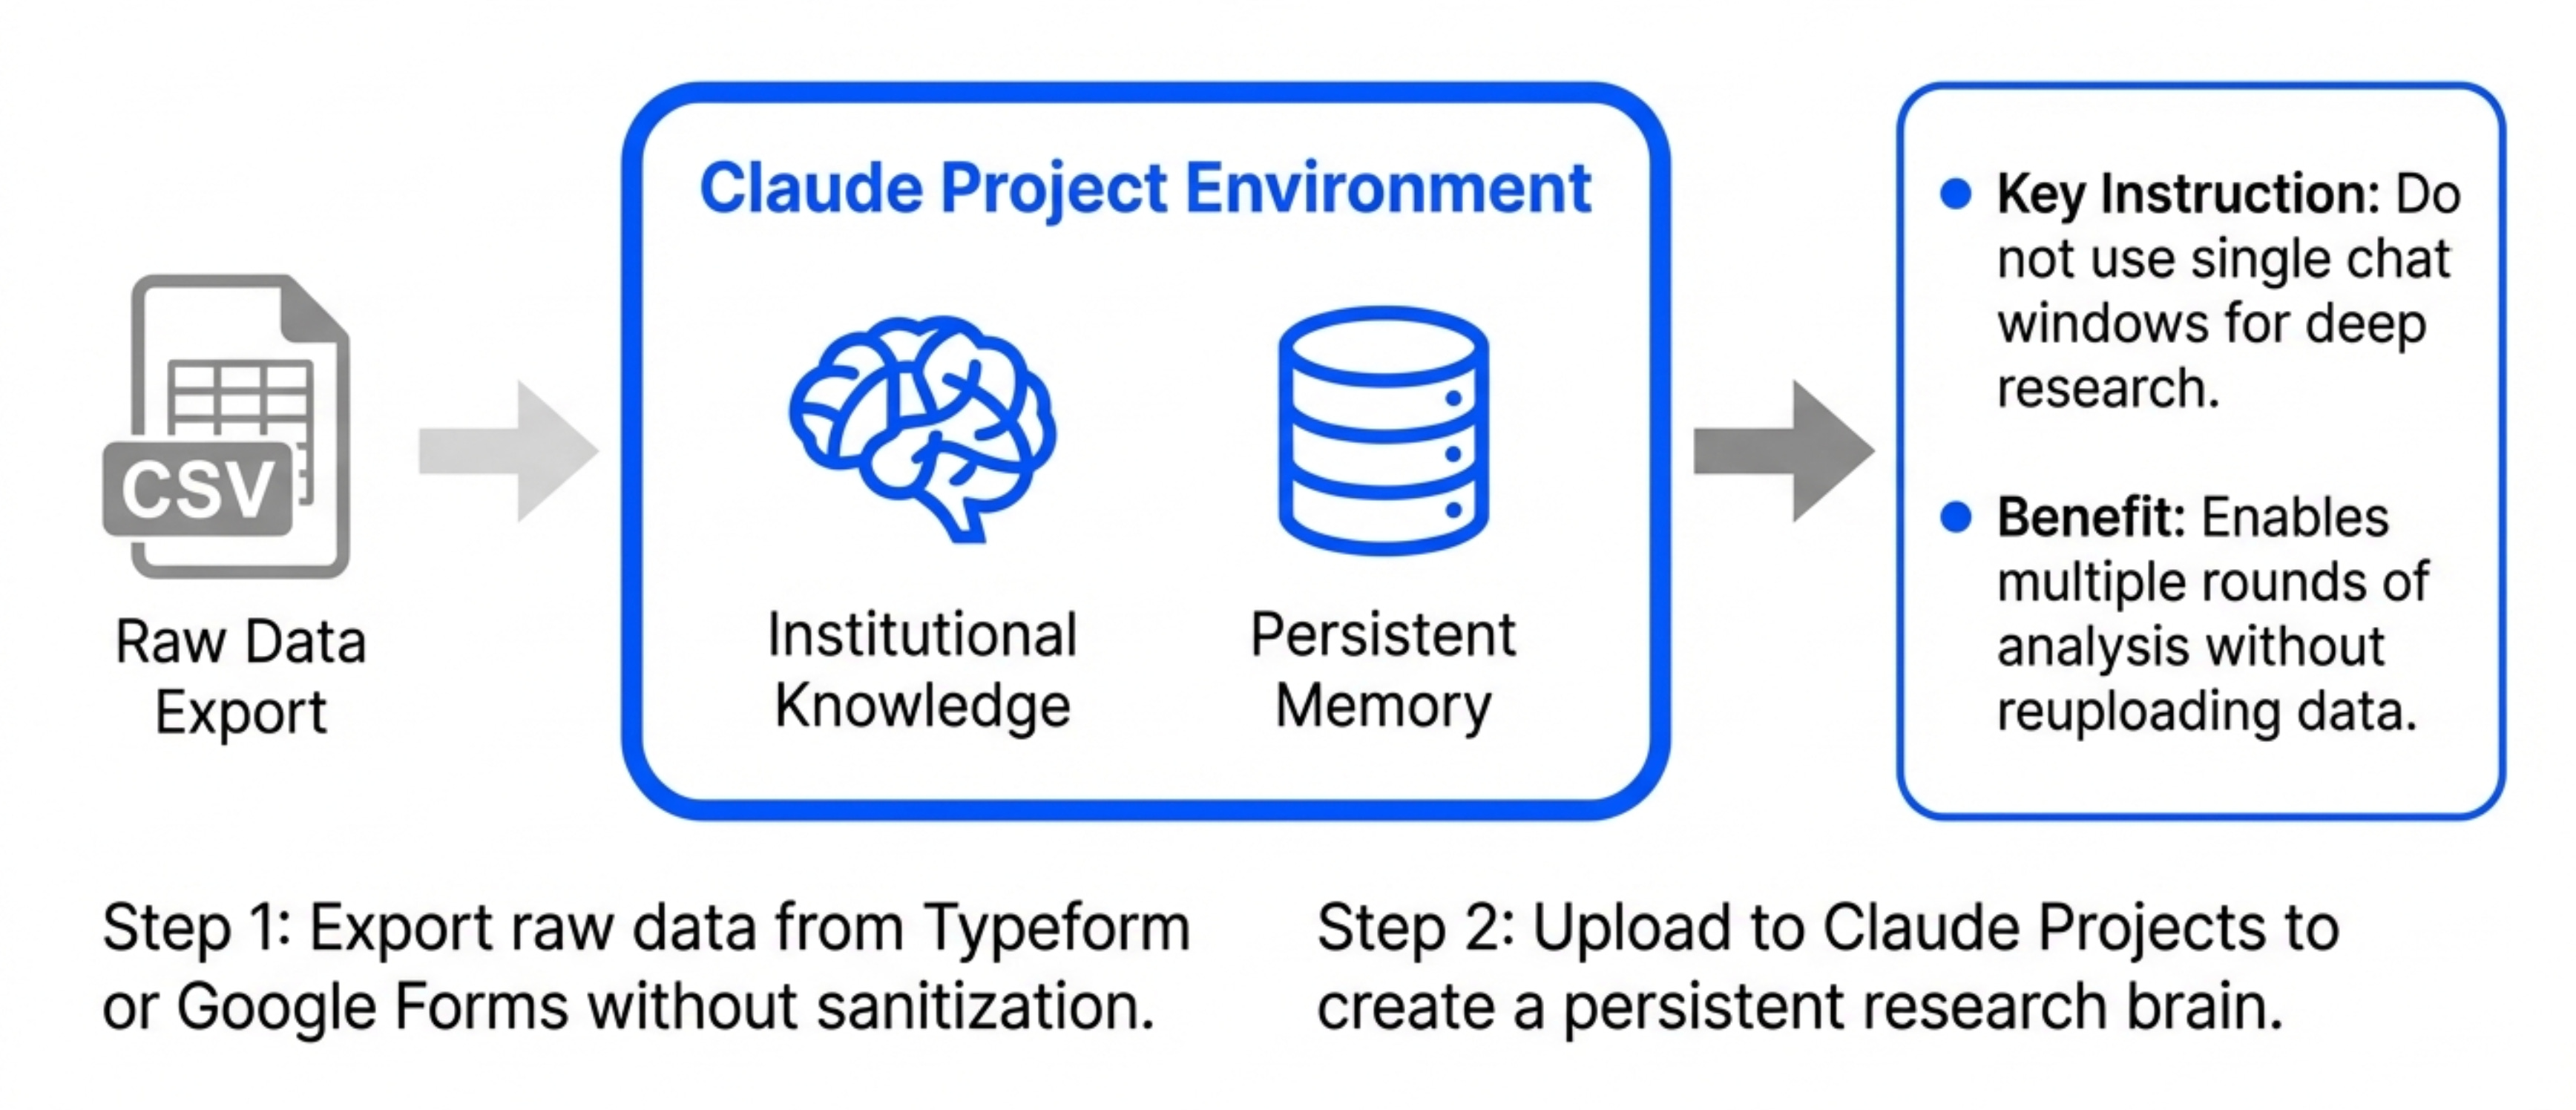
For Caitlin’s workflow, she just copies this data directly. No need to sanitize or clean it first.
Step 2 - Open Claude Projects
Here’s the first key decision point.
You can analyze surveys in two ways:
Option A - Single conversation in regular Claude
Good for: One-off analysis, quick insights, learning the workflow
Downside: No memory between sessions, have to reupload data each time
Option B - Claude Projects with uploaded files
Good for: Ongoing research, multiple rounds of analysis, building institutional knowledge
Downside: Requires paid Claude Pro subscription
The better path is Claude Projects. The advantage is you can upload all your survey data and interview transcripts once, then reference them in multiple conversations.
Create a new project called something like “Meditation App Retention Study.”
Upload your survey responses spreadsheet.
Step 3 - Write the Analysis Prompt
This is where most people struggle.
Generic prompts like “analyze this survey” produce generic outputs. You need structure.
Here’s the exact prompt structure from the episode:
I have survey responses from [product] users about [topic].

Please analyze the data and provide:

1. Overall patterns and themes
2. Key insights by question
3. User segments (if patterns emerge)
4. Actionable recommendations

For each insight, include:
- The finding
- Supporting evidence (quotes)
- Implications for product decisions
The key elements:
Context - Tell Claude what this is (product, topic, goal)
Structure - Define exactly what outputs you want
Evidence requirement - Ask for quotes to back up claims
Actionability - Force conclusions that inform decisions
This structure ensures you get usable output instead of generic observations.
Step 4 - Review Initial Analysis
Claude processes the data and returns structured findings.
For the meditation app survey, it identified:
3 stable subscriber segments (daily meditators, therapy seekers, sleep users)
2 at-risk segments (price-conscious users, feature explorers)
4 key retention drivers (habit formation, therapy integration, sleep quality, guided content)
3 churn risk factors (price increases, feature removal, competitor features)
Each finding included supporting quotes from actual survey responses.
This initial analysis takes about 2-3 minutes to generate.
Step 5 - Dig Deeper with Follow-Up Prompts
The real power comes from iterating.
The follow-up prompt:
For the "therapy seekers" segment, can you:

1. Extract all relevant quotes
2. Identify their specific pain points
3. Compare what they get from our app vs traditional therapy
4. Recommend features that would increase their retention
This produces a focused deep-dive on one segment.
The beauty of Claude Projects is you can come back tomorrow and ask “What did we learn about therapy seekers?” and Claude remembers the analysis.
You’re building institutional knowledge that persists.
Step 6 - Export to Markdown
Once you have findings you want to share, export them.
The approach that works best: Ask Claude to format everything as a markdown document with:
Executive summary at the top
Detailed findings by section
All supporting quotes included
Recommendations clearly called out
Copy the markdown. Paste into your note-taking system. Share with your team.
Now you have a permanent record of the research, not just scattered conversation history.
Common Survey Analysis Mistakes
Mistake 1 - Not providing enough context
If you just upload a spreadsheet with no explanation, Claude has to guess what it’s looking at.
Always include: What product, what goal, what decisions this research informs.
Mistake 2 - Accepting the first output
The initial analysis is never complete. Iterate. Ask follow-ups. Dig into specific segments or questions.
Mistake 3 - Not exporting findings
If you leave everything in the chat, you’ll forget it. Export to markdown, save to your docs, make it permanent.
Mistake 4 - Analyzing surveys in isolation
Surveys tell you what people say. Interviews tell you what they mean. Usage data tells you what they do.
The best discovery processes combine all three sources.
3. The Step-by-Step Interview Analysis Workflow
Survey analysis is useful. But interview analysis is where AI really shines.
Interviews are rich, unstructured conversations. Extracting insights manually is time-consuming and inconsistent.
With AI, you can systematically analyze every interview the same way.
The Setup
You’ve conducted user interviews. You have transcripts.
For the demo, Caitlin analyzed meditation app retention interviews. The interviews explored:
Why users started using the app
What value they get from it
What would cause them to stop using it
How it compares to alternatives
Standard retention interview questions.
Step 1 - Get Clean Transcripts
Record your interviews (with permission). Use a transcription service.
Options:
Otter.ai (automatic transcription during Zoom calls)
Descript (upload recordings, get transcripts)
Riverside.fm (records and transcribes automatically)
Claude itself (upload audio files directly)
The transcript quality matters. Clean transcripts with speaker labels produce better analysis.
Format should be:
Interviewer: Why did you start using the meditation app?

User: I was going through a really stressful period at work...

Interviewer: What keeps you coming back?

User: Honestly, the therapy chat feature...
Step 2 - Define Your Analysis Framework
Before analyzing, decide what you’re looking for.
The framework that produces the best results is value anchors:
Value anchors are the core reasons users care about your product. The things that, if you removed them, users would leave.
For each interview, extract:
Value anchors - What specifically provides value
Supporting evidence - Exact quotes with timestamps
Competitive context - How this compares to alternatives
Retention risk - What might cause this user to churn
This framework ensures consistent analysis across all interviews.
You can use different frameworks depending on your goal. For feature validation, you might focus on usability issues and feature requests instead.
Step 3 - Create the Analysis Prompt
Here’s the exact interview analysis prompt:
I'm analyzing user interviews for retention research.
Please analyze this interview transcript and provide:
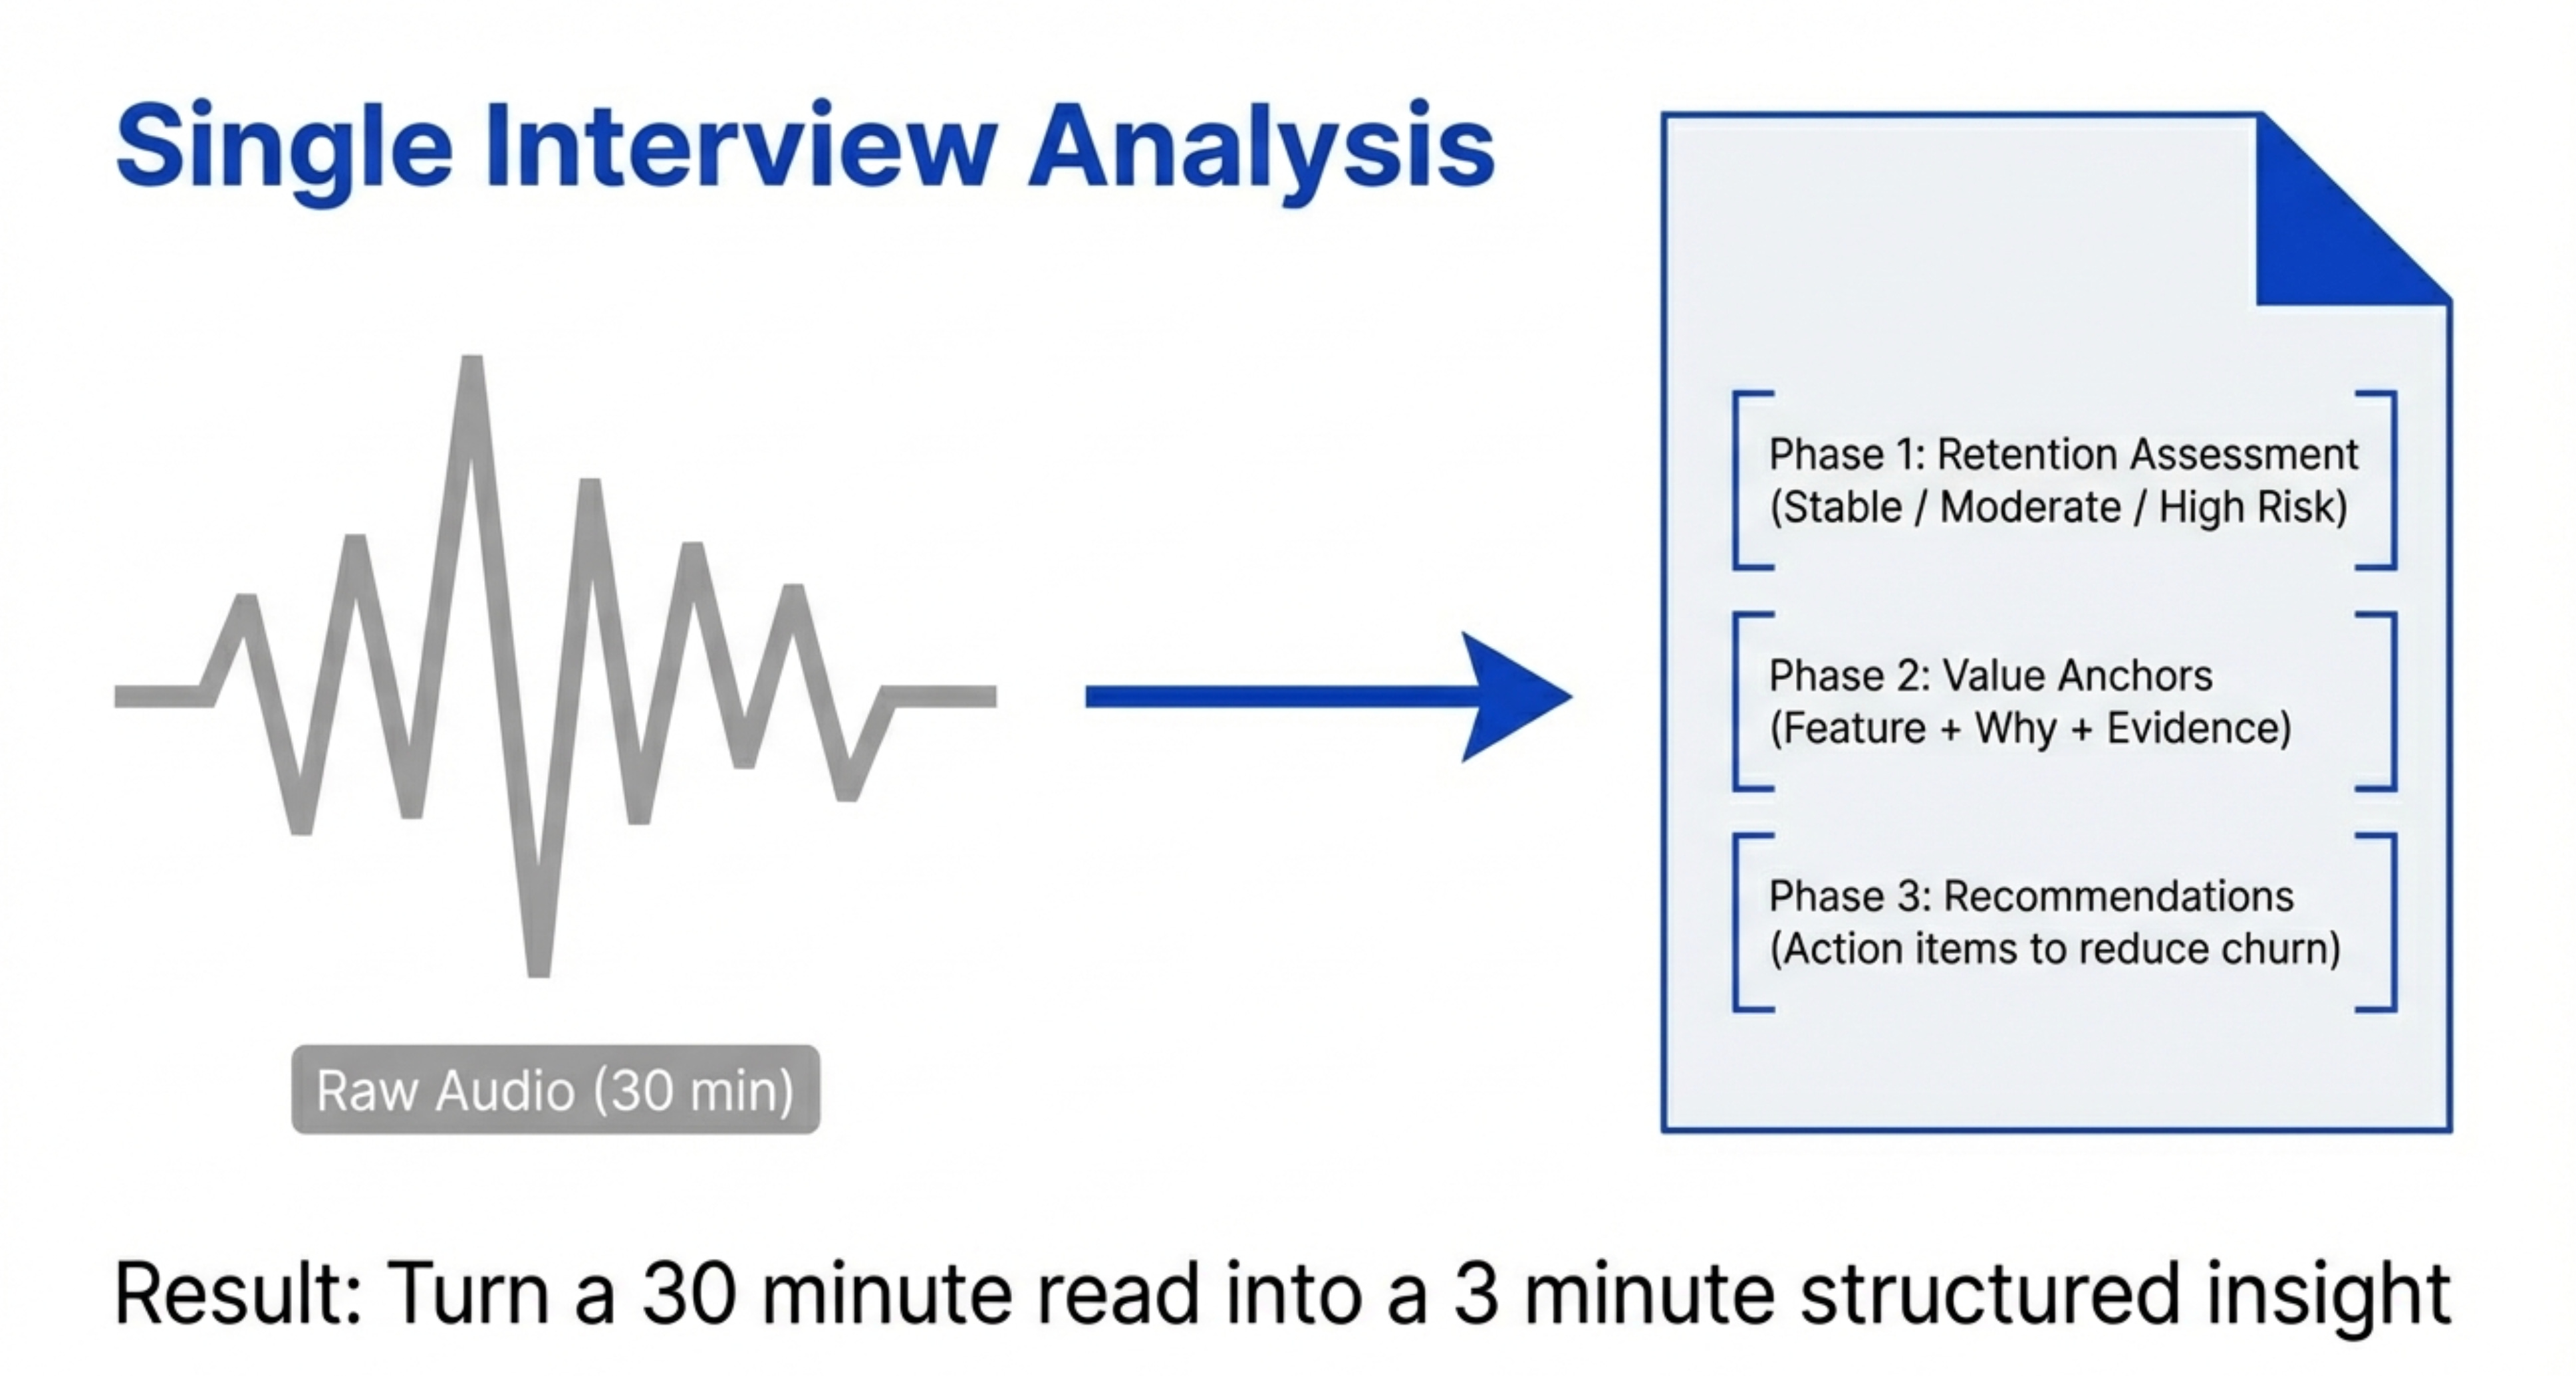
## Phase 1: Retention Assessment
- Retention segment (stable, moderate risk, high risk)
- Key retention drivers
- Churn risk factors
## Phase 2: Value Anchors
For each value anchor:
- Specific feature or capability they value
- Why it matters to them (quote with timestamp)
- How it compares to alternatives
- Risk if this value anchor were removed
## Phase 3: Recommendations
- What would increase this user's retention
- What product changes would reduce churn risk
- What competitive gaps we should address
Include exact quotes with timestamps for all findings.This prompt produces a structured analysis document for every interview.
Step 4 - Analyze One Interview
Upload the first transcript. Run the analysis prompt.
Claude processes the transcript and returns:
Retention Assessment: “Stable subscriber - high engagement, multiple value anchors, low churn risk”
Value Anchors:
Therapy chat feature (”This therapy chat feature directly addresses a gap that traditional therapy couldn’t fill” - 00:08:32)
Daily habit formation (”I’ve built it into my morning routine” - 00:14:12)
Sleep tracking integration (”The sleep quality improvements are measurable” - 00:21:45)
Recommendations:
Protect therapy chat feature (core retention driver)
Build on habit formation (push notifications, streaks)
Expand sleep analytics (more detailed insights)
Total analysis time: 3-5 minutes.
Compare that to the 30-60 minutes it would take to manually review the transcript, extract quotes, and organize findings.
Step 5 - Analyze All Interviews
Repeat for every interview transcript.
In the demo, we analyzed 5 interviews. That’s 15-25 minutes total.
Each interview gets its own structured analysis document.
The consistency is the key benefit here. Every interview is analyzed using the exact same framework, making patterns easier to spot.
Step 6 - Synthesize Across Interviews
Once you’ve analyzed all individual interviews, synthesize across them.
Prompt:
I've analyzed 5 interviews. Please synthesize findings across all of them:

1. What value anchors appear in multiple interviews?
2. What retention patterns are consistent across segments?
3. What churn risks are most common?
4. What recommendations apply across user types?

Organize findings by frequency (how many users mentioned each theme).
This produces your executive summary.
The output shows you which findings are one-offs vs which are patterns that matter.
For the meditation app:
Therapy chat - Mentioned by 4/5 users (critical feature)
Habit formation - Mentioned by 5/5 users (universal need)
Price sensitivity - Mentioned by 2/5 users (segment-specific)
Now you know where to focus.
Step 7 - Export Everything
Create a master document with:
Executive summary (synthesized findings)
Individual interview analyses (detailed breakdowns)
Supporting evidence (quotes with timestamps)
Recommendations (prioritized by frequency)
This becomes your research deliverable.
Share it with your team. Reference it in product strategy discussions. Use it to inform roadmap decisions.
The key is you have real evidence behind every decision. When someone questions why you’re prioritizing the therapy chat feature, you can point to 4 separate interviews with timestamped quotes.
4. How to Build Discovery Agents with Claude Code
Manual analysis works. But agents are better.
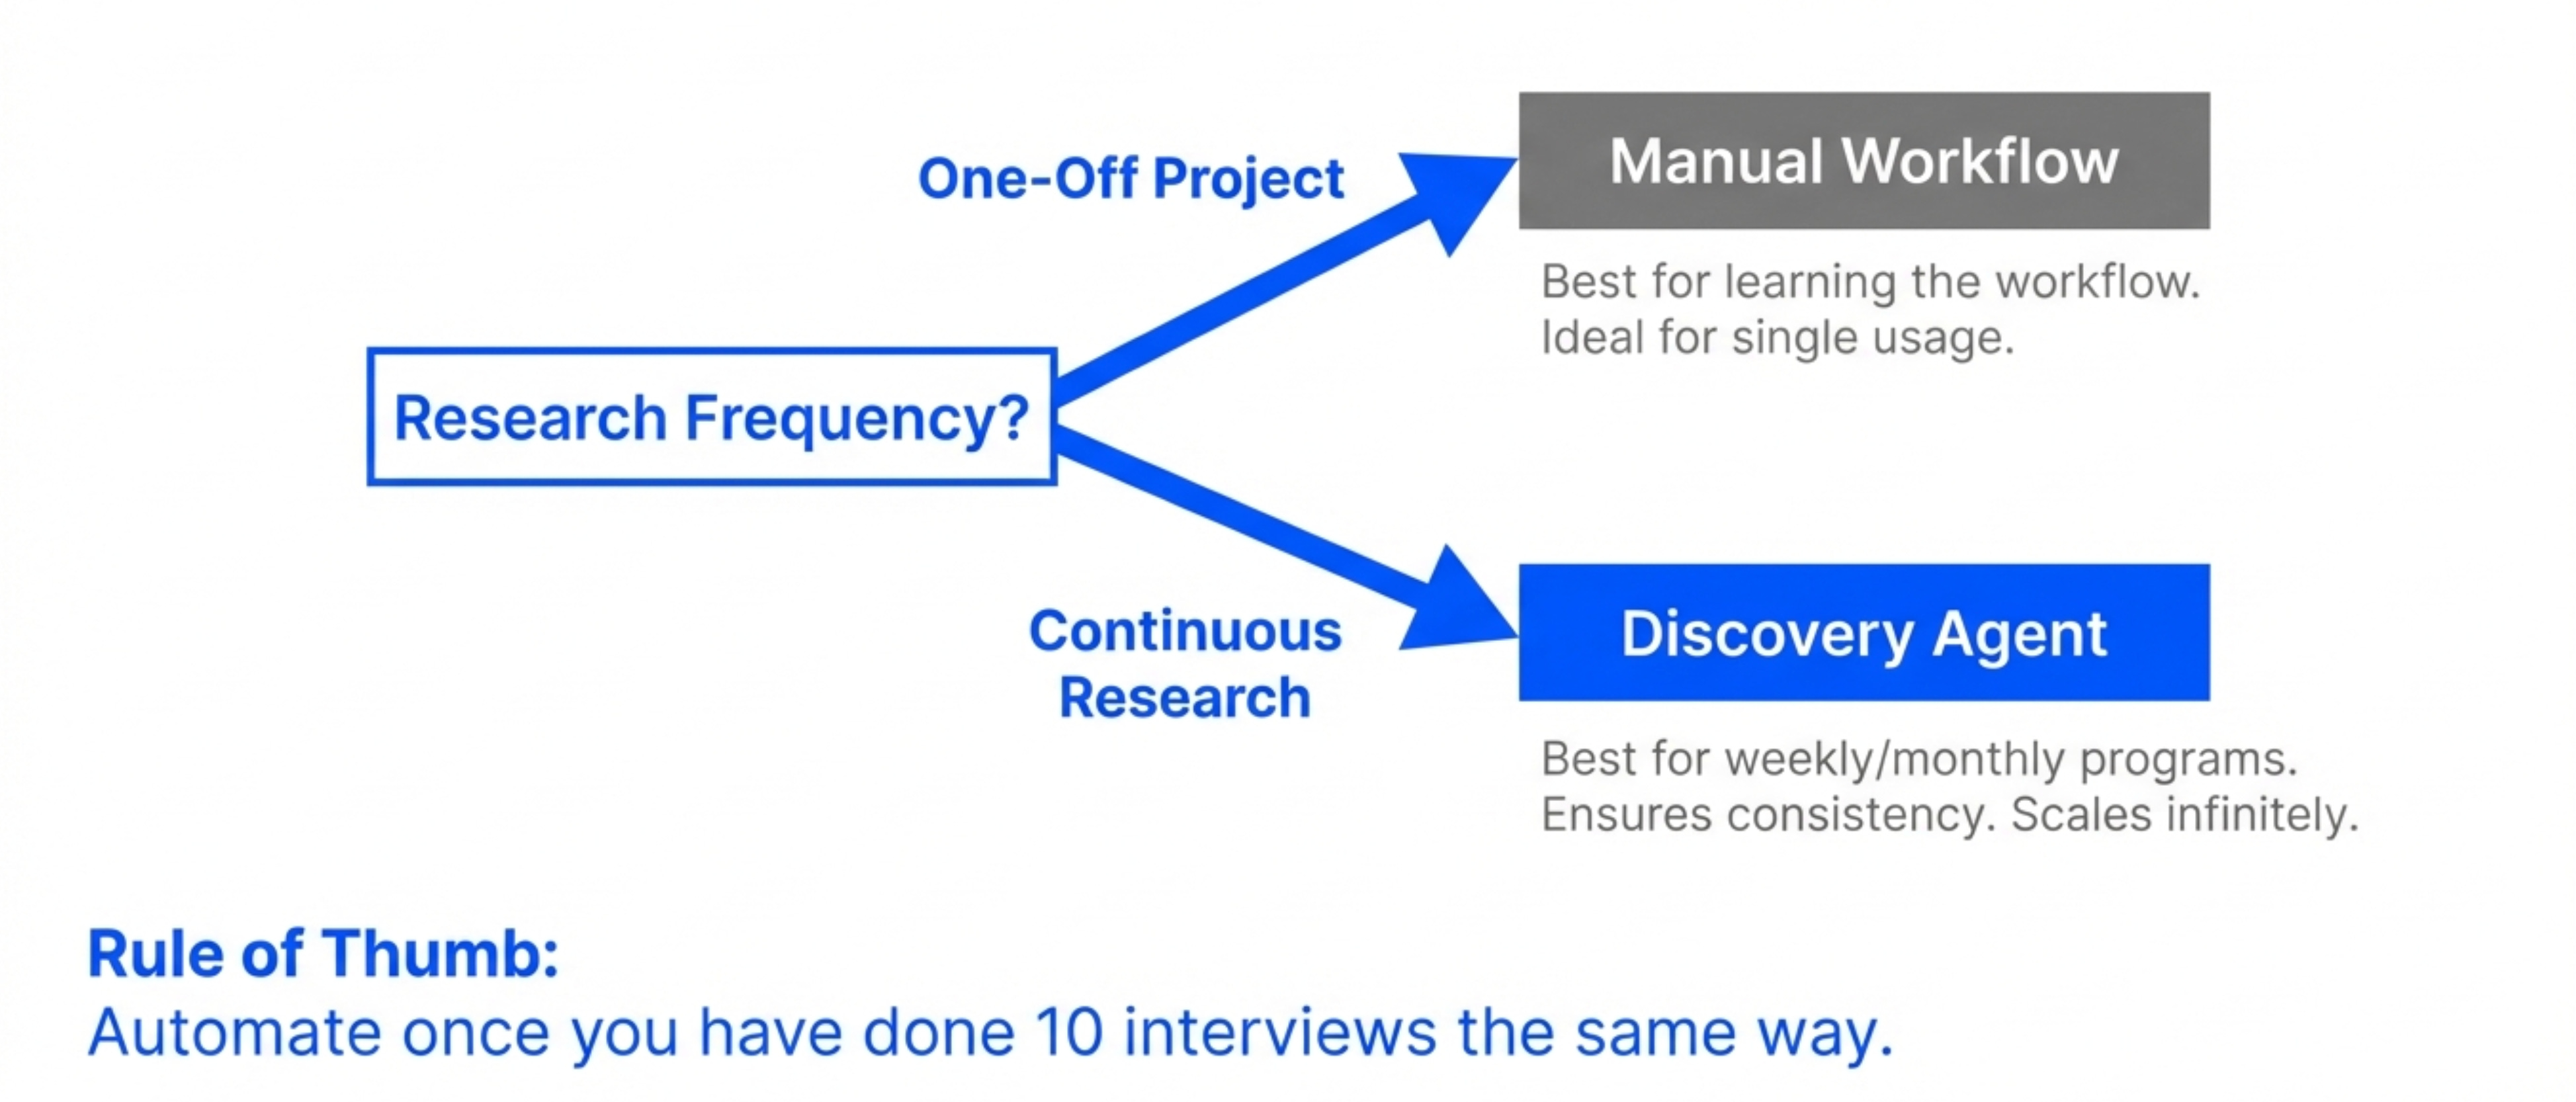
The difference between manual and agent-based:
Manual approach - You run prompts, review outputs, iterate, export results
Agent approach - You define the workflow once, the agent runs it automatically on all your data
For ongoing research programs, agents are worth the setup time.
When to Build Discovery Agents
Build agents when:
You’re running regular user research (weekly, monthly)
You need consistent analysis across many interviews
Multiple people on your team do research
You want to scale research without hiring more researchers
Don’t build agents when:
This is a one-time research project
You’re still figuring out your analysis framework
You don’t have technical resources to maintain the agent
Start with manual workflows. Once you’ve done 10+ interviews the same way, automate it.
The Architecture
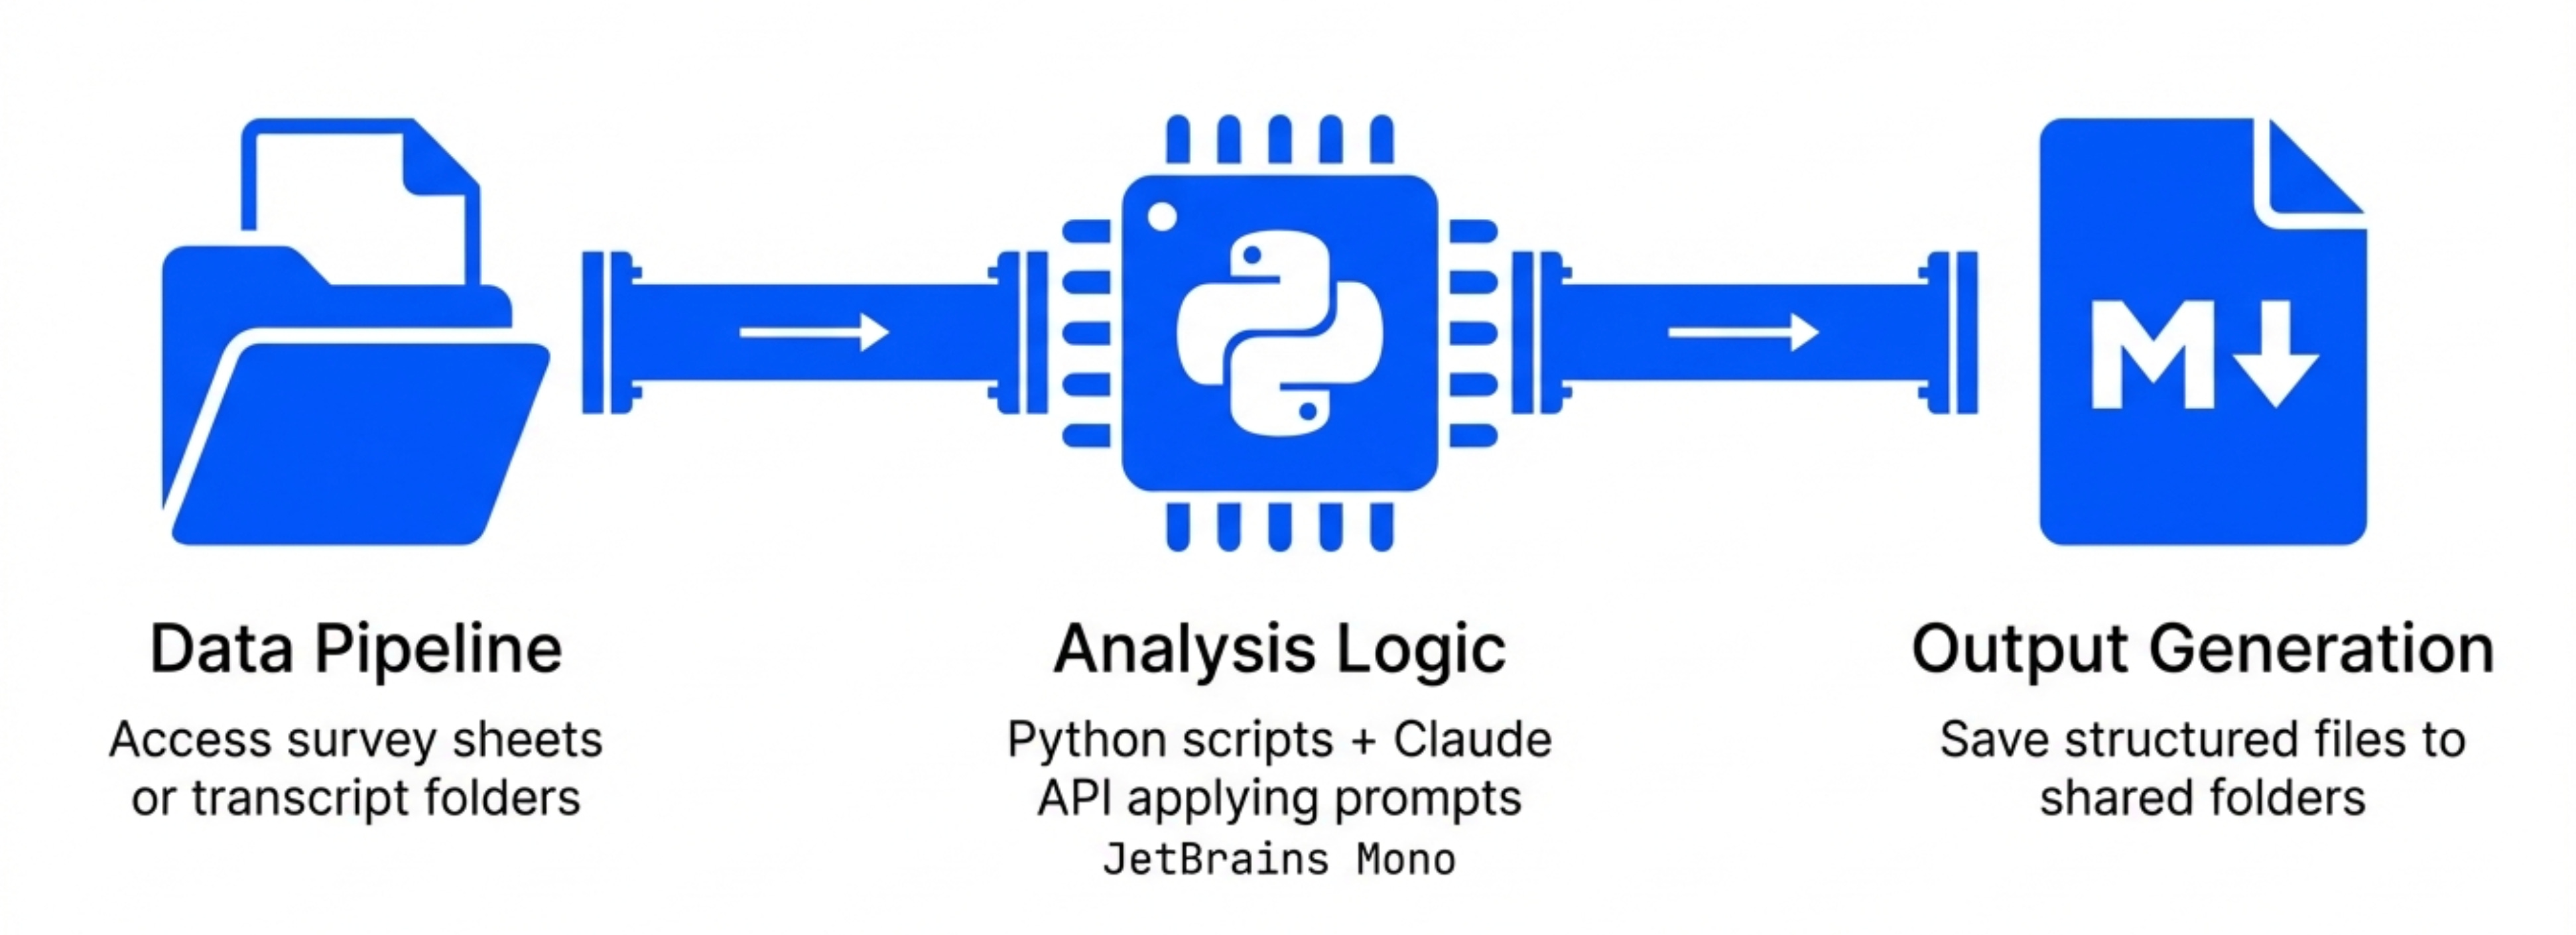
Discovery agents need three components:
Component 1 - Data Pipeline
The agent needs access to your research data.
For surveys: Google Sheets integration For interviews: Transcript files in a shared folder
Google Sheets works well for survey data. Local files work for interview transcripts.
Component 2 - Analysis Logic
This is where your prompts live.
The agent needs instructions for:
How to process survey responses
How to analyze interview transcripts
What outputs to generate
Where to save results
You’re essentially converting your manual workflow into code.
Component 3 - Output Generation
The agent needs to save results somewhere useful.
The agent outputs markdown files with:
Executive summaries
Detailed findings
Supporting quotes
Recommendations
These files automatically save to a shared folder where her team can access them.
Step 1 - Set Up the Project File
Create a file called instructions.md that defines your agent’s behavior.
Here’s what the instructions file looks like:
# Discovery Analysis Agent

## Purpose
Analyze user research data (surveys and interviews) for the meditation app retention study.

## Data Sources
- Survey responses: [Google Sheets link]
- Interview transcripts: /transcripts folder

## Analysis Framework

### For Surveys
1. Read all responses
2. Identify patterns and themes
3. Segment users by behavior
4. Extract actionable insights
5. Output to survey-analysis.md

### For Interviews
1. Process each transcript individually
2. Extract value anchors with timestamps
3. Assess retention risk
4. Provide recommendations
5. Output to interview-analysis-[name].md

## Output Format
All outputs should be markdown files with:
- Executive summary
- Detailed findings
- Supporting evidence
- Recommendations
This file becomes the agent’s operating manual.
Step 2 - Build the Survey Analysis Script
Claude Code can write the script for you.
Prompt:
Based on the instructions.md file, write a Python script that:

1. Connects to the Google Sheets survey data
2. Analyzes responses using the Claude API
3. Generates a structured markdown report
4. Saves the report to survey-analysis.md

Use the analysis prompt from my previous manual workflow.
Claude Code generates the script.
The script uses:
Google Sheets API to read survey data
Claude API to analyze responses
File system operations to save results
You don’t need to write any of this yourself. Claude Code handles the implementation.
Step 3 - Build the Interview Analysis Script
Same process for interviews.
Prompt:
Write a Python script that:

1. Reads all transcript files from /transcripts folder
2. Analyzes each interview using the Claude API
3. Generates individual analysis reports
4. Saves reports to interview-analysis-[name].md

Use the value anchors framework from my previous manual workflow.
Claude Code generates another script.
This one loops through all transcript files and processes them automatically.
Step 4 - Test the Agent
Run both scripts on your existing data.
Check the outputs:
Do the survey findings match your manual analysis?
Are interview analyses using the correct framework?
Are quotes properly extracted with timestamps?
Are markdown files properly formatted?
Iterate on the prompts and scripts until outputs are consistent with manual analysis.
This testing phase is critical. You’re essentially training the agent to think like you.
Step 5 - Schedule Automatic Runs
Once the agent works reliably, schedule it.
Options:
Run manually when new data arrives
Schedule weekly runs (for ongoing research programs)
Trigger runs when new files appear in the transcripts folder
The simplest approach: Run the agent whenever you complete a new batch of interviews.
Drop transcript files in the folder, run the script, get analysis reports in minutes.
The Results
In the demo, the agent analyzed:
1 survey dataset with 20+ responses
5 interview transcripts
Total runtime: Less than 2 minutes.
Total output: 6 markdown files with structured findings.
The analysis quality matched the manual workflow. But it happened automatically.
This is the power of AI agents for discovery. You define the workflow once, then scale it infinitely.
5. Advanced Techniques for Production-Grade Analysis
The basic workflows work. But here are the advanced techniques that separate good analysis from great analysis.
Technique 1 - Comparative Analysis
Don’t just analyze your own data. Compare it to competitive alternatives.
The advanced version of the survey prompt includes:
For users who mentioned considering alternatives:
1. What alternatives did they consider?
2. What features attracted them to those alternatives?
3. What kept them with our product instead?
4. What would cause them to switch?
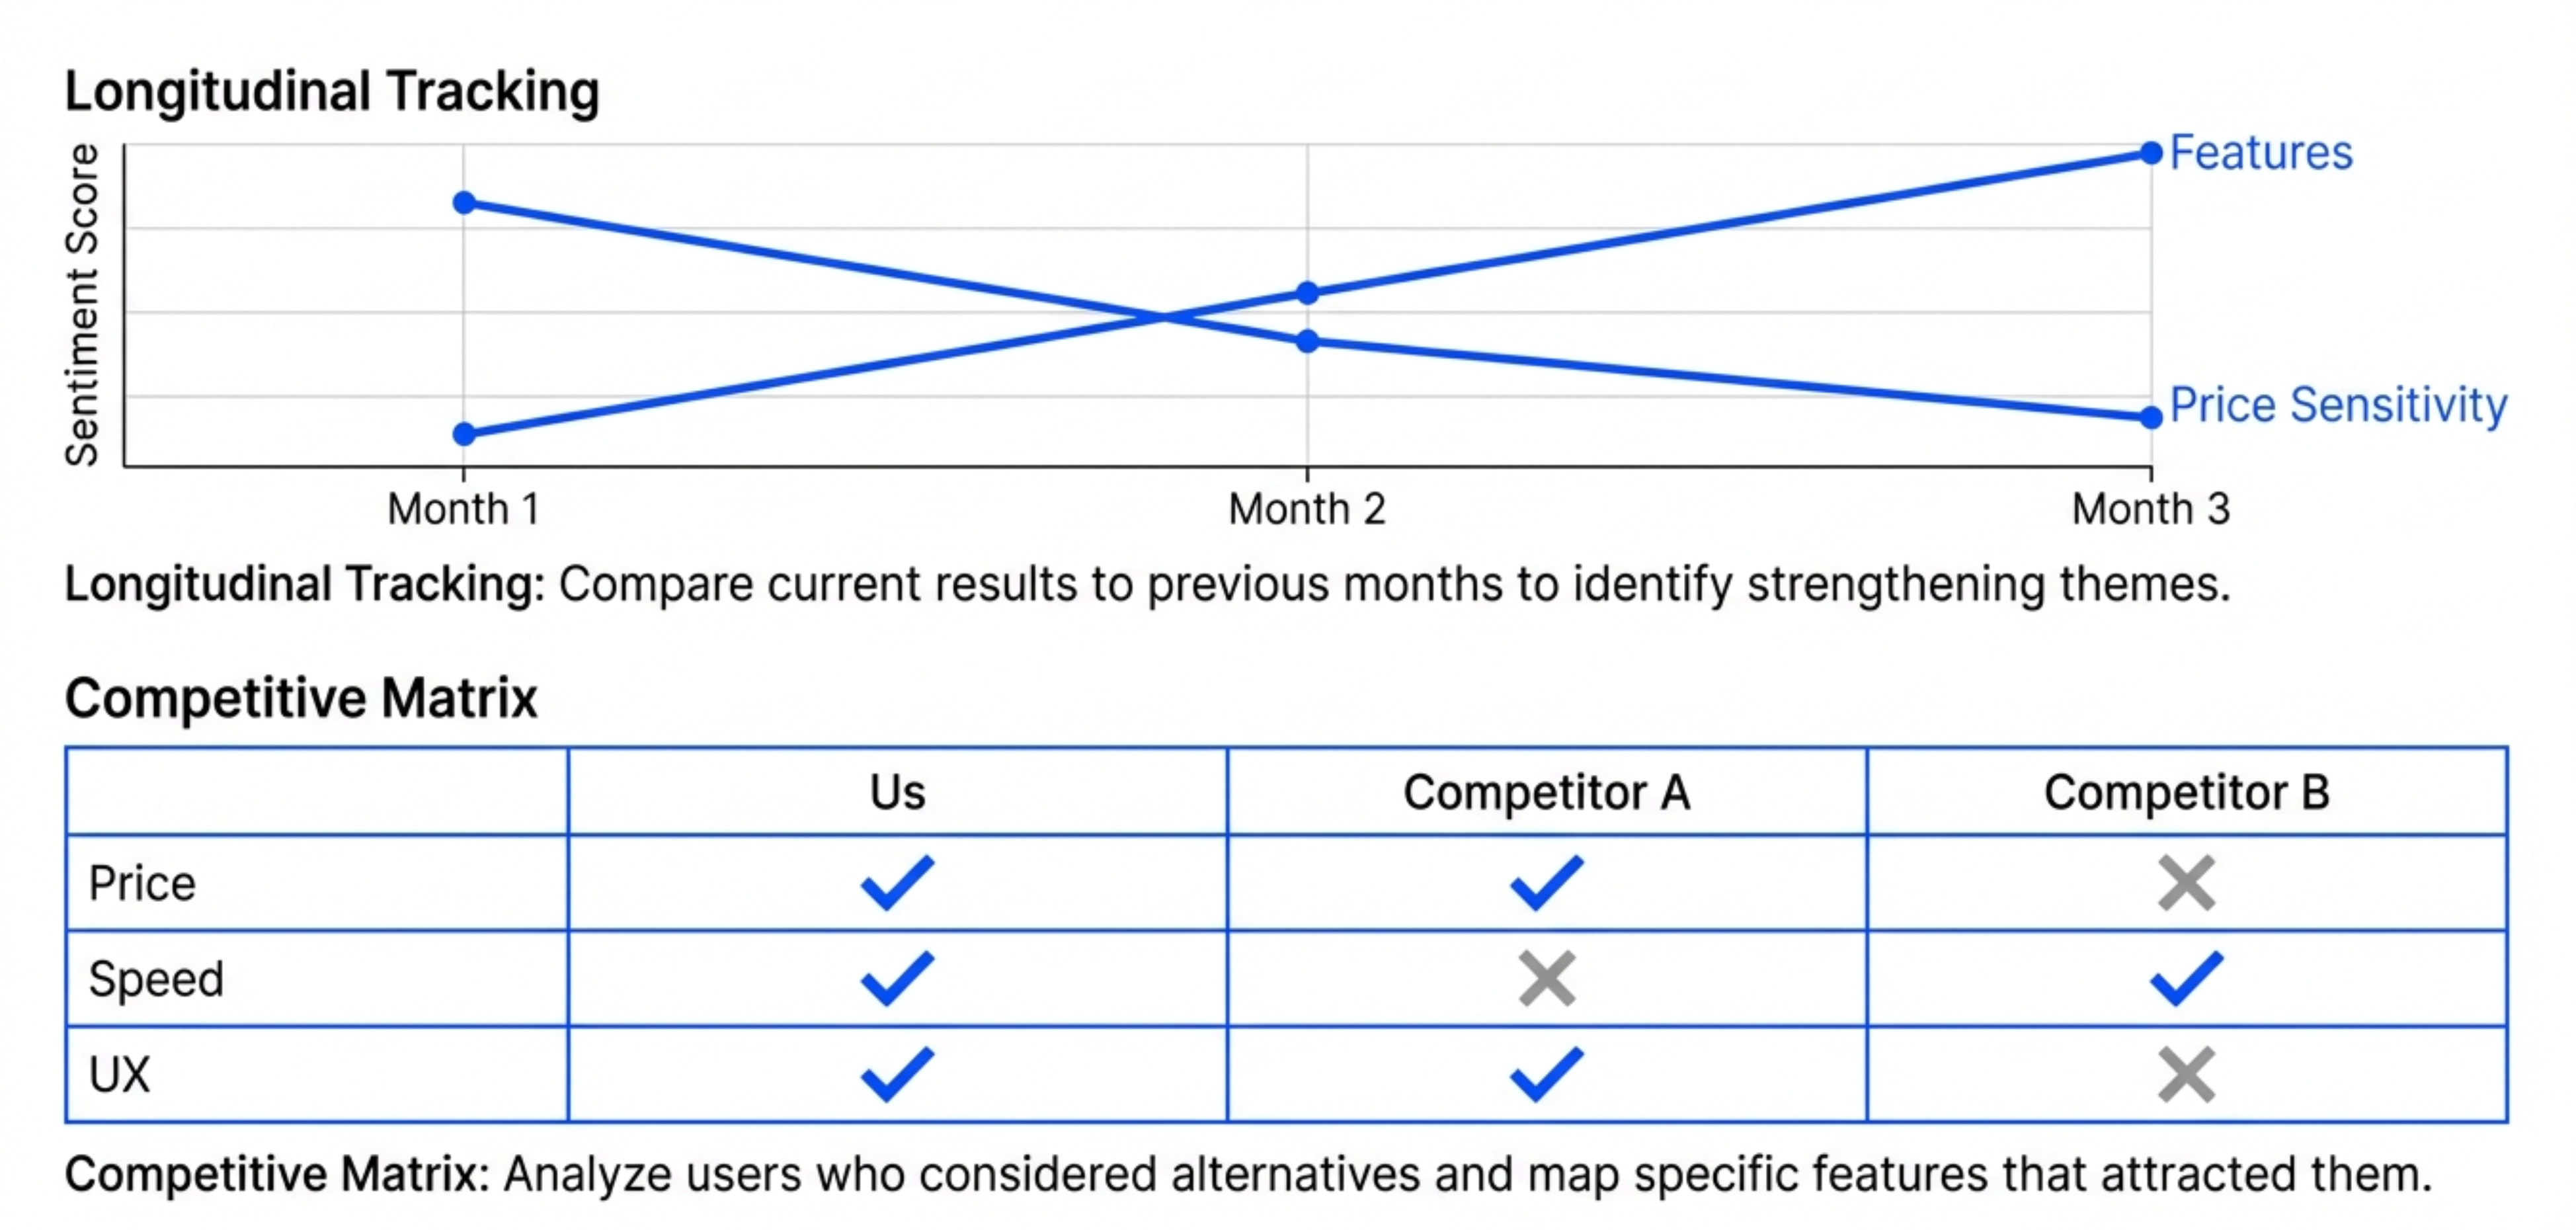
Organize findings as a competitive feature matrix.This produces a structured comparison of your product vs alternatives, based on what actual users say.
You can use this to inform product strategy and identify competitive gaps.
Technique 2 - Longitudinal Tracking
If you run regular research, track how findings change over time.
Create a master synthesis document that combines:
This month’s survey findings
Last month’s survey findings
Trend analysis (what’s changing)
Prompt:
Compare the survey results from [current month] to [previous month]:

1. Which themes are strengthening?
2. Which themes are weakening?
3. Are new patterns emerging?
4. What retention risks have increased?

Highlight any significant changes.
This helps you spot trends before they become problems.
Technique 3 - Sentiment Analysis
Beyond extracting what users said, analyze how they said it.
Advanced prompt:
For each interview, assess:

1. Overall sentiment (positive, neutral, negative)
2. Emotional intensity (calm, frustrated, excited)
3. Confidence level (certain, uncertain, conflicted)

Use this to prioritize which feedback matters most.
A user who’s calmly explaining a minor annoyance is different from a user who’s frustrated about a major blocker.
Sentiment analysis helps you prioritize.
Technique 4 - Hypothesis Testing
If you have specific hypotheses, test them against the data.
Hypothesis: “Users who integrate the app into their morning routine have higher retention.”
Prompt:
Analyze all interviews for evidence supporting or refuting this hypothesis:

"Users who integrate the app into their morning routine have higher retention."

For each interview:
- Does the user have a morning routine?
- Is the app part of it?
- What's their retention segment?

Calculate the correlation.
Claude can process your research data to validate or invalidate specific hypotheses.
This is similar to how you’d use product analytics to test quantitative hypotheses. But you’re doing it with qualitative data.
Technique 5 - Risk Scoring
Build a simple scoring system to prioritize users by retention risk.
Scoring framework:
Assign each user a retention risk score (0-10) based on:

- Number of value anchors (more = lower risk)
- Price sensitivity mentioned (yes = higher risk)
- Alternative consideration (yes = higher risk)
- Feature dependency (fewer dependencies = higher risk)

Output a ranked list from highest to lowest risk.
This helps you identify which users to focus retention efforts on.
Technique 6 - Feature Prioritization Matrix
Combine research findings with usage data to prioritize features.
Prompt:
Create a feature prioritization matrix:

Columns:
- Feature name
- Number of users who mentioned it
- User segment requesting it
- Retention impact (high/medium/low)
- Competitive gap (yes/no)
- Recommended priority (P0/P1/P2)

Sort by recommended priority.
Now you have a data-backed roadmap prioritization framework.
Final Words
Bad discovery happens when you treat it as a phase. Good discovery happens when you treat it as a habit.
The best PMs continuously gather evidence, analyze patterns, and adjust course.
AI makes this possible.
Start with the manual workflows Caitlin showed. Analyze one survey. Process one interview. Get comfortable with the prompts.
Then build it into your regular rhythm. Weekly surveys. Monthly interviews. Continuous synthesis.
You’ll have superpowers soon enough.
Where to Find Caitlin Sullivan
Maven Course (use code AAKASHxMAVEN for 15% off)
Related Content
Newsletters:
Podcasts:
PS. Please subscribe on YouTube and follow on Apple & Spotify. It helps!