
How to Build a Scaled Experimentation Engine
How OpenAI, Notion, Atlassian, and other leading companies build trustworthy experimentation systems that scale impact and drive consistent product wins.

I teamed up with Statsig to interview 8 leading experts on scaled experimentation programs.
If you want to know what the future of product development looks like, look no further than OpenAI.
After onboarding with Statsig, they ran more experiments in 2 months than most companies do in an entire year.
The same pattern holds at Notion. The vast majority of what they ship gets measured, even features they have strong conviction about. Why? Because they want to understand if the gains were as material as expected and identify any potential harm.
These companies represent a new breed of product organizations that have moved beyond the question of "should we experiment?" to "how do we experiment at scale?"
It's not about whether you're running tests. It's about what percentage of your product team's output is being measured.
As Vineeth Madhusadhanan, PM at Statsig, puts it:
"Velocity doesn't matter if you're only running experiments on 20% of your output."
What It Really Comes Down To
Scaling the impact of your experiment program comes down to three critical elements:
Data lookup - making it easy to find results
Consistent and trustworthy results - experiments run the same way, people aren't able to cherry-pick
People running many experiments
"When I was at Meta, a lot of the value I added was remembering we had run experiments," says Craig Sexauer, Head of Data Experimentation.
That institutional memory is priceless. But it shouldn't live in someone's head.
Today’s Post
Continuing after my A/B testing 101, 201, and 202 posts, I’ve put together this A/B Testing 301 post with the key lessons from studying the best experimentation cultures:
The 3 key pillars of a scaled experimentation program
Trustworthy experiments
Institutional memory
Data culture
Most common mistakes
Application to you
The 3 Key Pillars of a Scaled Experimentation Program
The foundation of any successful experimentation program is trust. Without it, all the velocity in the world is meaningless.
"When you have trust, there is velocity. When you have velocity without trust, you don't actually accomplish much," notes Vineeth.
What makes experiments trustworthy? Let's explore three key challenges and their solutions:

Pillar 1 - Trustworthy Experiments
Three major challenges face us when trying to build trustworthy experiments.
Here’s how to address each and build a scaled program that everyone trusts. Even your most skeptical stakeholders - like Sales and the CEO:
Challenge 1: Outlier Customers Skewing Results
For many companies, especially in B2B, a single large customer can completely skew metrics.
This problem isn't limited to B2B—any business with power users faces similar challenges when trying to run reliable experiments.
Standard Method: Winsorization
The standard approach to handling outliers is winsorization—a statistical technique that caps extreme values at a predetermined threshold (typically the 95th or 99th percentile).
This minimizes the influence of outliers while still keeping all data points in the analysis.
"Winsorization is effective for most consumer applications where you have occasional outliers," explains Data Scientist Craig Sexauer. "But it's less suitable when those 'outliers' actually represent your most valuable customers."
RECOMMENDED SOLUTION 1: Automated Stratified Sampling
When outliers matter a lot—like in B2B scenarios where a "whale" customer drives significant revenue—you need a more advanced approach. Stratified sampling mathematically guarantees you won't have significant imbalances between test groups.
Craig explains: "Stratified sampling is especially useful for experiments where a tail-end of power users drive a large portion of a metric value, such as in B2B experiments with small sample sizes."
The implementation is surprisingly straightforward: You provide a balancing metric (like contract size or user activity level) during experiment setup, and the system ensures control and test groups are balanced accordingly.
For B2B companies with limited user numbers, this approach is transformative—delivering trustworthy results without requiring complex statistical adjustments or removing valuable data points.
RECOMMENDED SOLUTION 2: CUPED
CUPED (Controlled-experiment Using Pre-Experiment Data) has become the gold standard at companies like Microsoft, Meta, and Snap.
Since Microsoft introduced it in 2013, it has revolutionized how sophisticated companies approach experimentation.
At its core, CUPED is a regression adjustment technique that uses pre-experiment data as a covariate to dramatically reduce variance in your experiment results.
The outcome? You can detect smaller effects with the same sample size, or get results faster with higher confidence.
"All modern experimentation platforms have regression adjustment," explains Craig. "If you make an adjustment to your estimator that is unbiased with respect to the experiment, that estimator will remain unbiased and provide less variance."
Snapchat has extended this approach further, running multiple regressions to extract even more statistical power from their experiments.
The business impact is significant:
Small companies get statistically significant results with smaller samples
Large companies get results faster, enabling more testing cycles
Challenge 2: Accounting for Time and Novelty Effects
Another trust killer in experimentation is novelty effects. Users often interact differently with new features initially, showing heightened engagement that fades over time.
I have experience with Novelty effects hundreds of times in my career - most prominently at Fortnite, where players would love a new feature for 2 weeks and then stop using it.
You have to account for it.
Without accounting for this phenomenon, teams can be misled by early positive results that don't represent long-term value.
Whatnot, a live shopping marketplace recently valued at $5B, has made detecting novelty effects central to their testing culture.
"Teams are acutely aware that many of their users exhibit strong novelty effects," Vineeth shared. "Once people get used to a feature, the impact often diminishes."
To combat this, they implement two key strategies:
Time-series analysis by default - examining how metrics evolve over days/weeks
Holdout groups - keeping a small percentage of users from seeing new features for extended periods
This approach ensures the team doesn't celebrate short-term wins that disappear once the novelty wears off.
Challenge 3: Consistency Across Experiments
For organizations running dozens or hundreds of experiments simultaneously, inconsistent methodology undermines trust in the entire program. When different teams use different significance thresholds, sample size calculations, or analytical techniques, comparing results becomes impossible.
"The biggest trust killer is when two similar experiments show wildly different results," explains Craig. "People immediately question the entire system."
The solution is standardization:
Centralized experiment configuration with sensible defaults
Automated quality checks that flag methodology deviations
Clear documentation of any necessary experimental variations
Companies like Meta and Microsoft have invested heavily in standardizing, ensuring that an experiment run by the News Feed team could be directly compared to one from the Ads team.
Remember: "The purpose of experimentation is to get closer to users and learn more about them—not simply picking A or B."
Pillar 2 - Institutional memory
Even the best experiments are worthless if the organization forgets what it learned.
Think about your own company. How many times have you seen teams test the same idea, not because the first test was inconclusive, but because no one remembered it had been done before?
That's why institutional memory is critical.
Batting Average View: Your Metric Scoreboard
One of the most effective tools for building institutional memory is what Statsig calls the "Batting Average View."

This approach lets you look at any metric and see:
All the experiments that moved this metric
What percentage of experiments moved the metric
How much each experiment moved it
Imagine being able to say: "We've run 15 experiments aimed at improving signup conversion. Five of them (33%) showed statistically significant improvements, with an average lift of 8%."
That's powerful context for prioritizing future work.
Documentation That Doesn't Create Friction
Vista faced the challenge of scaling experimentation across a 5,000-person organization.
Kevin Anderson, PM of Experimentation at Vista, built a three-part documentation system:
Business rationale - Why are we doing this experiment?
Labels and metadata - Product area, priority, locale, etc.
Standardized metrics - For program-level reporting
The key insight: Documentation needs to happen automatically during experiment setup, not as a separate step that creates friction.
"When you set up an experiment, you have to set up a hypothesis," Kevin explains. "As the team sets up, we can bring automatically the metrics that team is looking at."
This approach makes it easier for new teams to join the experimentation culture while ensuring critical context is preserved.
Cross-Team Learning
Tim Chan, Head of Data, emphasizes that institutional memory isn't just about remembering what your team did—it's about learning from across the organization.
"Having an experimental record is really useful. If you're brand new to a team and want to understand experiments from the last 6 months, you can see what they've been focusing on, if they're hitting a brick wall, or what wins they've had."
This cross-pollination of insights is what takes experimentation from a team tactic to an organizational strategy.
Pillar 3 - Data culture
The final—and perhaps most challenging—element of scaling experimentation is building a strong data culture.
"Most of scaling an experimentation program is around the data culture," Tim Chan explained. "Getting the whole org to speak that language."
A healthy data culture requires three key elements:
1. Standardization
Everyone in the organization needs to use the same definitions and methodologies:
Common metric definitions (What exactly counts as "revenue"?)
Consistent statistical approaches (Same significance thresholds)
Uniform experimental frameworks (Same methods across teams)
Without standardization, you can't compare results across experiments or teams.
2. Trust Over Gaming
"Sometimes, companies have a full-blown experimentation program going, but they're not guardians of the data culture," Tim noted. "It turns into PMs gaming the system, shipping results, claiming huge wins, and putting it in performance reviews."
The result? Complete loss of trust.
At Meta, Tim observed a different approach: "We felt data is the truth. People could be swayed by strong data."
The cultural norm was valuing right actions over being right—a subtle but critical distinction.
3. Statistical Literacy
The most common error Tim sees? "If teams aren't crunching the statistics, they don't appreciate the error margin. People put up A vs B with a dashboard in a product like Datadog, but they don't have any appreciation if the differences they're seeing are real or just noise."
Basic statistical literacy—understanding concepts like statistical significance, confidence intervals, and sample sizes—needs to be widespread, not confined to data scientists.
Building Data Culture From Scratch
Kevin Anderson shared how Vista approaches building data culture:
"You have to optimize on different levels. For teams that want to do experimentation, make it as easy as possible, remove friction points, be hyper focused on the process."
For teams resistant to testing: "There's often a lack of leadership understanding the benefits of experiments. In those cases, it's about trying to influence those areas by bringing examples and showing what we've learned from other experiments."
Vista also implemented welcome sessions for new employees: "You never know who's going to be the next top experimenter. It's really nice to know what kind of background they have. Sometimes they come from companies who have done lots of experiments."
2. The 6 Most Common Mistakes in A/B Testing
Even sophisticated companies make these common experimentation mistakes:
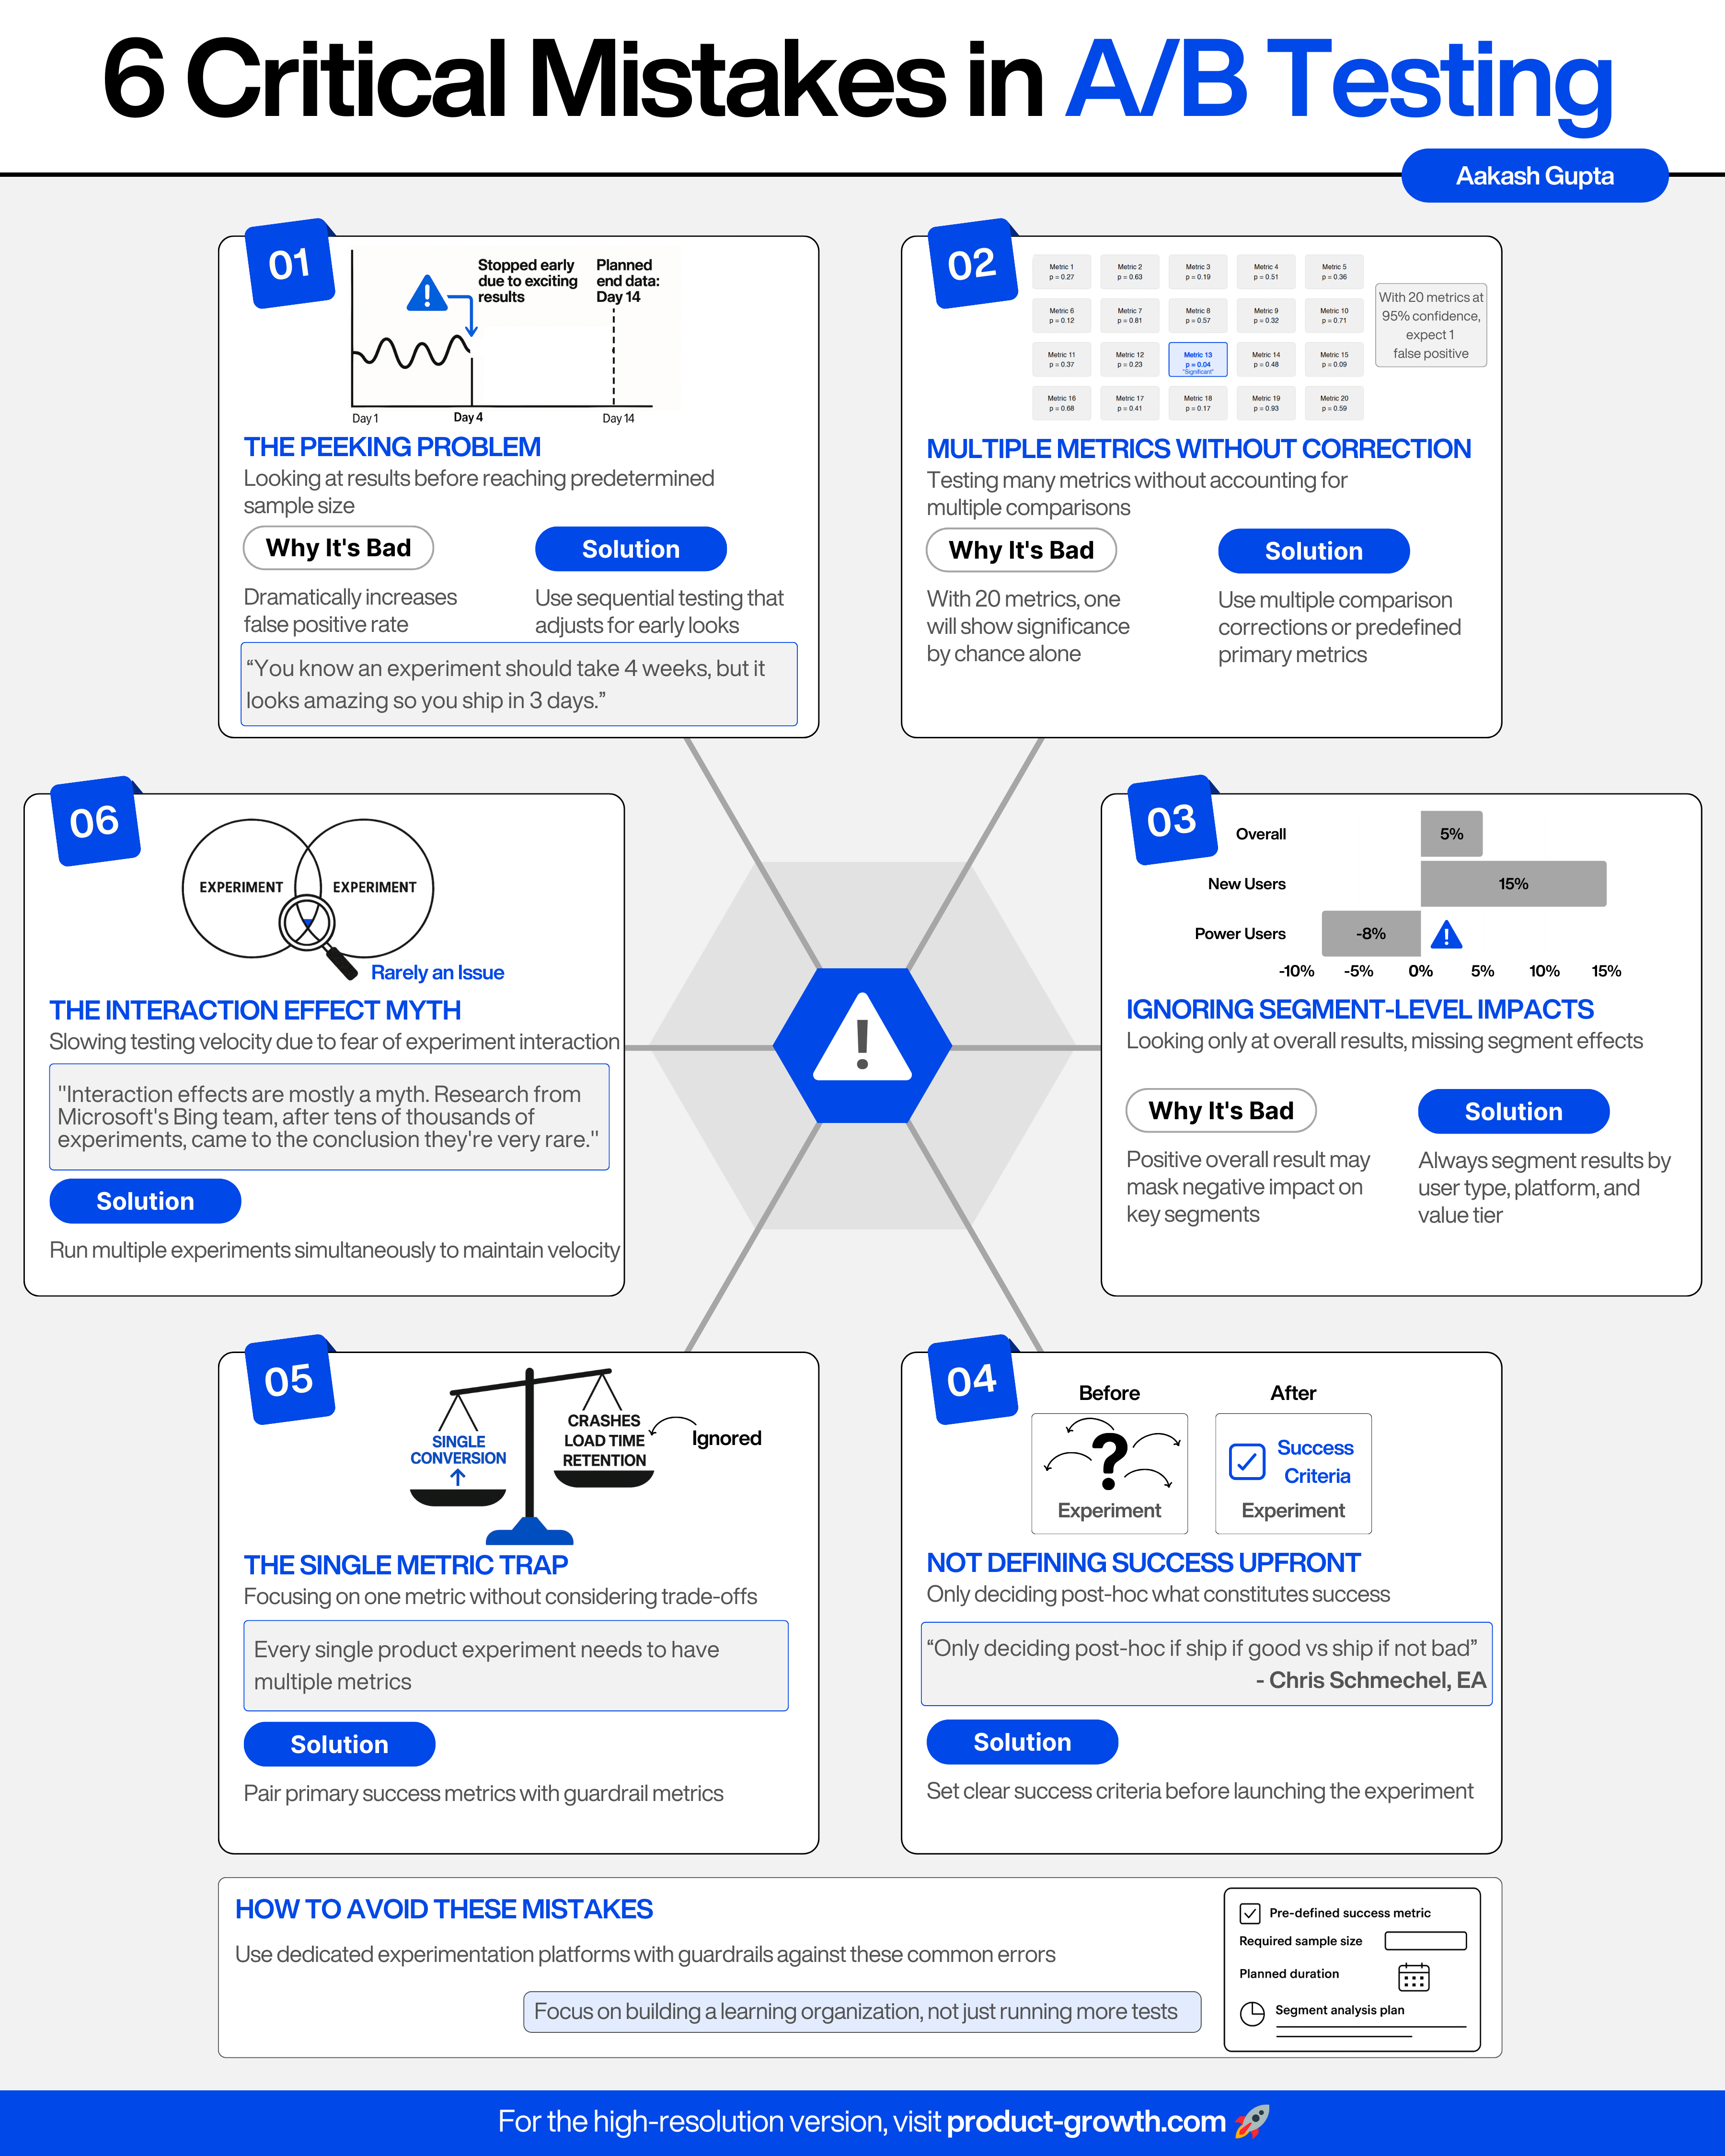
Here's how to avoid them:
Mistake 1 - The Peeking Problem
"You know an experiment should take 4 weeks, but it looks amazing so you ship in 3 days," Tim explained. "But if you're looking at results everyday, the statistics are based on one peek at the end of experiment."
This is perhaps the most pervasive mistake in A/B testing. Checking results before reaching your predetermined sample size dramatically increases your false positive rate.
The solution? Sequential testing that automatically adjusts confidence intervals to account for early looks.
Mistake 2 - Multiple Metrics Without Correction
Running tests with multiple metrics without accounting for multiple comparisons is a recipe for false positives.
With 20 metrics, you'd expect one to show statistical significance by pure chance at a 95% confidence level.
Most modern experimentation platforms now implement multiple comparison corrections automatically, but the human tendency to fixate on "significant" results remains strong.
Mistake 3 - Ignoring Segment-Level Impacts
Looking only at overall results can hide important segment-level effects.
This is especially dangerous when a positive overall result masks negative impacts on your most valuable customers—a classic example of Simpson's Paradox.
Always segment your results by key user attributes (new vs. returning, desktop vs. mobile, high-value vs. low-value) to ensure you're not missing critical insights.
Mistake 4 - Not Defining Success Upfront
"Only deciding post-hoc if ship if good vs ship if not bad," as Chris Schmechel from EA puts it.
"Even at Meta scale, you have experiments that aren't stat sig. Say upfront what the condition is - very likely will ship if looks okay vs only invest in if clearly good."
Setting clear success criteria before launching an experiment prevents the natural human tendency to rationalize results after the fact.
Mistake 5 - The Single Metric Trap
"Every single product experiment needs to have multiple metrics," Tim emphasized. "We're not in a theoretical world of a single metric."
Always pair primary success metrics with guardrail metrics to ensure you're not improving one aspect of the user experience at the expense of another.
"If you think you're going to drive up user time spent through some new feature, you will want to have guardrails on that, eg health checks and crash rates. If you're only reading out a single metric, you're missing out on that richness in understanding the experiment."
Mistake 6 - The Interaction Effect Myth
Many teams slow their experimentation velocity out of fear that concurrent tests will interact with each other.
"Interaction effects are mostly a myth," Tim stated. "The human brain convinces itself they exist. Research from Microsoft's Bing team, after tens of thousands of experiments, came to the conclusion they're very rare."
Don't sacrifice velocity for a problem that barely exists.
3. Applying This to Your Organization
Now that we've covered the key elements and common mistakes, how do you implement these insights in your organization?

Start by assessing your current state.
Pillar 1 - Trustworthy Experiments
Are outlier customers or users skewing your results?
Do you have tools to detect and address novelty effects?
How confident are stakeholders in your experiment results?
Pillar 2 - Institutional Memory
Can teams easily find results from past experiments?
Is experiment documentation creating friction or happening automatically?
How effectively do insights travel across team boundaries?
Pillar 3 - Data Culture
Do all teams use the same metric definitions and statistical approaches?
Is your organization rewarding right actions or just being right?
What's the level of statistical literacy among PMs and other stakeholders?
Based on your assessment, prioritize improvements.
Remember, the goal isn't just to run more experiments—it's to build a learning organization that continuously improves, based on what those experiments reveal.
Up Next
These are the types of deep dives I do every week! I hope you enjoyed the last one on AI prototyping. Here’s what’s next:
The Art of Winning Referrals to Jobs
Advanced Tactics: Product Sense Interview
How to Ace The Presentation Round of PM Interviews
Be sure to become a paid subscriber to receive all deep dives:
This deep dive was created in partnership with Statsig. Want to learn how leading companies like Notion and OpenAI are scaling their experimentation programs? Check out statsig.com to learn more.
What experimentation challenges are you facing? Drop them in the comments below!
In a mature experimentation system, what would the interaction between Traditional PM and a Growth PM look like?
Most of the startups I work with do not have a system of experimentation. Your points are spot on.