Become an A/B Testing Expert: Advanced Topics in Testing for PMs
A/B Testing 201: Covering 6 key topics Sample ratio mismatch, statistical power, A:A testing, outcome vs context metrics, leading vs lagging metrics, and the "one" metric
When it comes to product analytics generally - and A/B testing in particular - who does the analysis tends to vary wildly by team and company:
Have a dedicated product analyst ⇢ PM is the thought partner but not executor
Have a part-time analyst ⇢ PM is the requestor
No analyst ⇢ The PM is the analyst
No PM ⇢ The founders, engineers or designers are the analyst!
Outside product looking to influence it ⇢ Anyone from BizOps to Finance may be analyzing an A/B Test
The point being: often times, people who aren’t product analytics are evaluating the results of A/B tests.
Read: people who aren’t experts.
So, it blows my mind how low the general level of knowledge on A/B testing is.
The average tech worker certainly understands just enough about A/B testing to think they can interpret the data, but are liable to make several mistakes.
That’s what today’s piece is here to change.
Real Feedback in Interviews
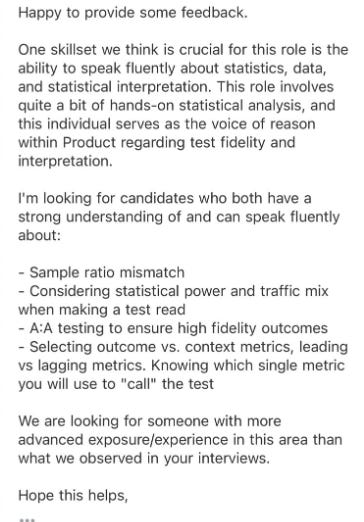
Think this is all just theoretical talk? Even interviewers are looking for your knowledge here.
A subscriber in our Slack community shared the following feedback after an interview:
So these are actually topics that interviewers are assessing PMs as weak on.
The good news: This is all learnable. So let’s dive in!
Today’s Post
Words: 6,245 | Est. Reading Time: 28 mins
We’re going to put on our statistical hats today and get into each of these topics:
Deep Dive into 6 key advanced stats topics
2 - Considering statistical power and traffic mix
3 - A/A testing to ensure high fidelity outcomes
4 - Leading vs Lagging metrics
If you only have 30 seconds, these are the 5 takeaways you need to know
Implement a chi-square test to automatically detect Sample Ratio Mismatch (SRM) in your A/B tests.
Use power analysis to calculate required sample sizes for each user segment, not just overall.
Run quarterly A/A tests to calibrate your "noise threshold" for each key metric.
Map your leading metrics to lagging outcomes with actual correlation coefficients.
For every new feature, identify potential negative impacts and include metrics to monitor them.
Now let’s get into the whole deep dive…
A Note on the Academic Standard
As you know, in this newsletter, I try to never share any information that you can get anywhere else on the web. There’s enough repeat-rinse-reuse of the PM basics out there on the web.
You come to this newsletter for new insights. That’s the “academic standard” for this newsletter. So what are the new insights in today’s piece, if there’s no survey or interviews?
My stories! I’m going to share all my lessons from doing 1000s of A/B tests over the years.
So, let’s get into it.
1. The Most Common Mistakes
In my 15 years as a VP of Product, I've witnessed the full spectrum of A/B testing mistakes. From startup founders to FAANG PMs, nobody is immune to these errors.
What's worse, I've made most of them myself.
And here's the kicker: the most dangerous mistakes often come from those who think they've mastered A/B testing.
So let’s not fall into that camp. These are the 5 most common mistakes I’ve seen people make with A/B testing:
(How many have you seen?)
Mistake 1 - Peeking
What it sounds like:
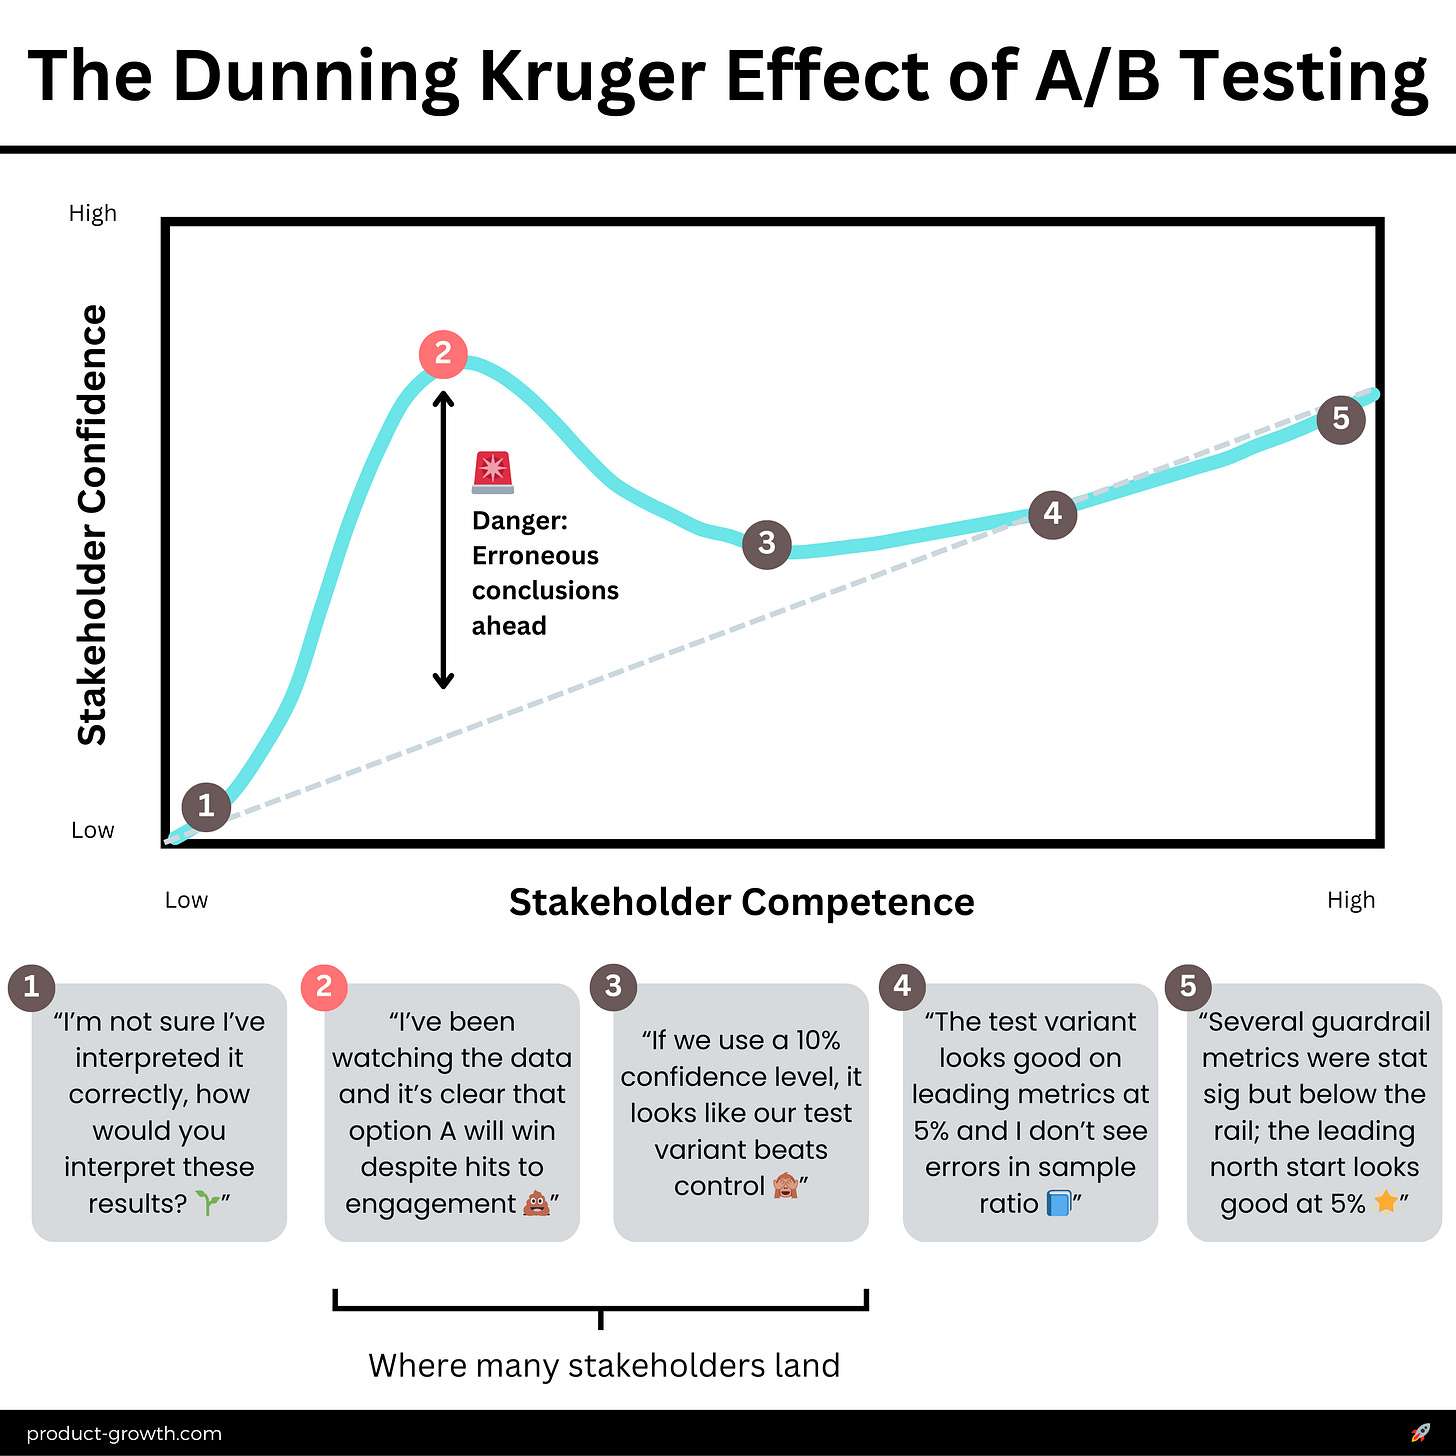
"I've been watching the data, and it's clear that option A will win despite hits to engagement."
I see this mistake more often than any other. And it is the silent killer of good A/B tests.
What exactly is peeking? A formal statistical mistake:
Peeking: Checking test results before reaching the predetermined sample size, inflating the Type I error rate (false positive rate) beyond the intended significance level.It dramatically increases your likelihood of a false positive, sometimes by an order of magnitude.
But why do so many well-intentioned CEOs and execs cause it? You see, in your average tool’s calculator, if you have a big enough change in the metrics, even at a small sample size, it will deem it as statistically significant.
But peeking is a mistake.
I once had to roll back a major feature launch after discovering we'd fallen into the peeking trap. We thought we'd struck gold with a 20% conversion increase, only to find out later that our early conclusion was a statistical mirage.
The actual long-term impact? A 5% decrease in conversions. Ouch.
Solution: To avoid this, implement a strict "no peeking" policy. Use power analysis (example free tool) to determine your sample size upfront, and stick to it.
If you absolutely must make early decisions, use sequential testing methods with appropriate alpha spending functions. Trust me, the discipline pays off.
Mistake 2 - The Significance Snafu
"If we use a 10% confidence level, it looks like our test variant beats control!"
I once had an associate PM come to me, excited about a "significant" result.
Turns out, they'd lowered the confidence level to 90% to get a positive result.
We nearly shipped a feature based on this before catching the error. It was a teachable moment for the entire team. This was a classic case of a formal statistical mistake:
P-value Misinterpretation: Incorrectly interpreting p-values or manipulating confidence levels to achieve "significant" results, leading to an inflated rate of false positives and potentially incorrect conclusions.It's a slippery slope. Once you start bending the rules, it's hard to stop.
Solution: Stick to pre-determined significance levels, typically 95%. No exceptions. Emphasize effect sizes and confidence intervals over p-values.
I recommend a "no adjustments" policy for significance levels. It feels strict, but, especially as PMs who care about real impact, it's liberating.
Mistake 3 - The Multiple Comparison Muddle
"Several metrics improved significantly! We've struck gold!"
I've seen entire product launches derailed by this error. We once celebrated a "successful" test where 3 out of 20 metrics improved significantly.
What we didn't realize was that with 20 metrics, we'd expect 1 false positive by chance alone. Here’s the statistical concept:
Multiple Comparisons Problem: The increased risk of false positives when analyzing multiple metrics simultaneously without appropriate corrections, due to the cumulative probability of finding a significant result by chance.It's a statistical trap that's claimed many victims. The more metrics you test, the more likely you'll see "significant" results by pure chance.
Solution: Use correction methods like Bonferroni or false discovery rate control. Consider global test statistics.
It all feels overly conservative until it saves you.
Mistake 4 - The Segment Blindness Syndrome
"The overall results look great, so let's roll it out to everyone!"
This error nearly sank a promising startup I was advising.
Their team pushed a new pricing model showing a 10% overall revenue increase. Champagne time, eh?
Not so fast. It had devastated their high-value customer segment. What happened here? Another formal statistical paradox:
Simpson's Paradox: A phenomenon where a trend appears in different groups of data but disappears or reverses when these groups are combined, potentially leading to incorrect conclusions when segment-level impacts are not considered.It's shockingly common, even among experienced teams.
Solution: Always dig deeper into segment-level data. Make common the use of visualization techniques like forest plots.
It takes time upfront but prevents major missteps.
Mistake 5 - The Sample Ratio Mismatch (SRM) Slip-up
"The test looks good!”
Unsaid: I didn't check if the traffic split was actually 50/50
This one is a silent killer. I learned the hard way.
We ran a months-long test at thredUP only to realize a caching issue had skewed our 50/50 split to 70/30.
We had tripped another statistical mistake:
Selection Bias (in Sample Ratio Mismatch): A systematic error in sampling where the actual user split doesn't match the intended ratio, potentially invalidating test results and leading to unreliable conclusions.I've seen teams make major product decisions based on these skewed results.
Solution: Implement automated SRM checks. Calculate Chi-Squares even on top of those. These are quick checks that can save you from major headaches.
Now, let’s move into 3 less common mistakes - but nevertheless important ones. From there, we’ll get into the stats one layer deeper.
Keep reading with a 7-day free trial
Subscribe to Product Growth to keep reading this post and get 7 days of free access to the full post archives.


