
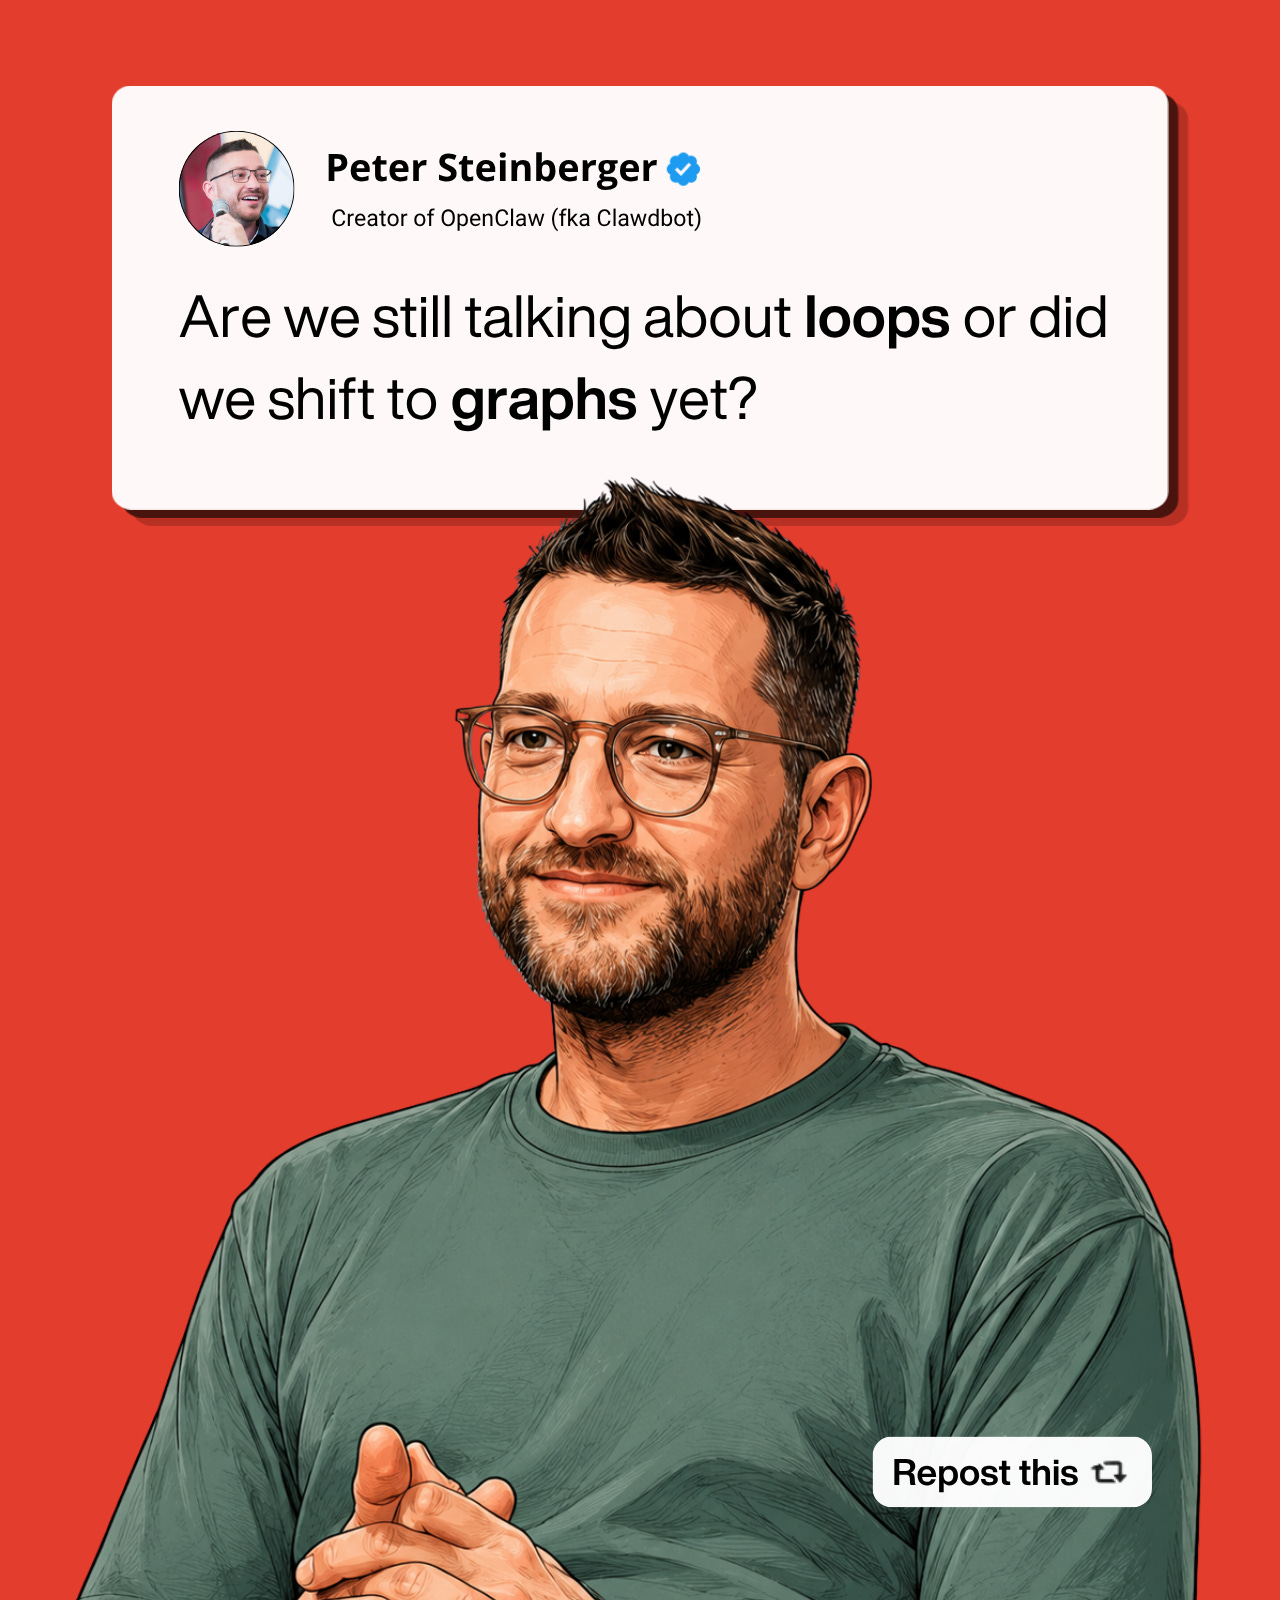
Just a few weeks ago, we moved onto Loops. Then Peter Steinberger, founder of OpenClaw, prompted us to move on to the next thing:
So do PMs all need to learn graphs now?
I spent a few weeks testing them for you to find out. The answer is, perhaps unfortunately, yes.
But the good news is: they’re extremely easy to learn and prompt.
And with today’s post, you’ll get a rigorously tested library of graphs engineered for 40 high-value PM tasks.
So let’s walk through it.
Today’s Post
What is a graph and how did we end up here
The graph lego blocks to build from
Graph construction in practice
The PM graph library
1. What is a Graph, and how did we get here?
The five hype cycles we’ve seen in AI actually build upon each other.
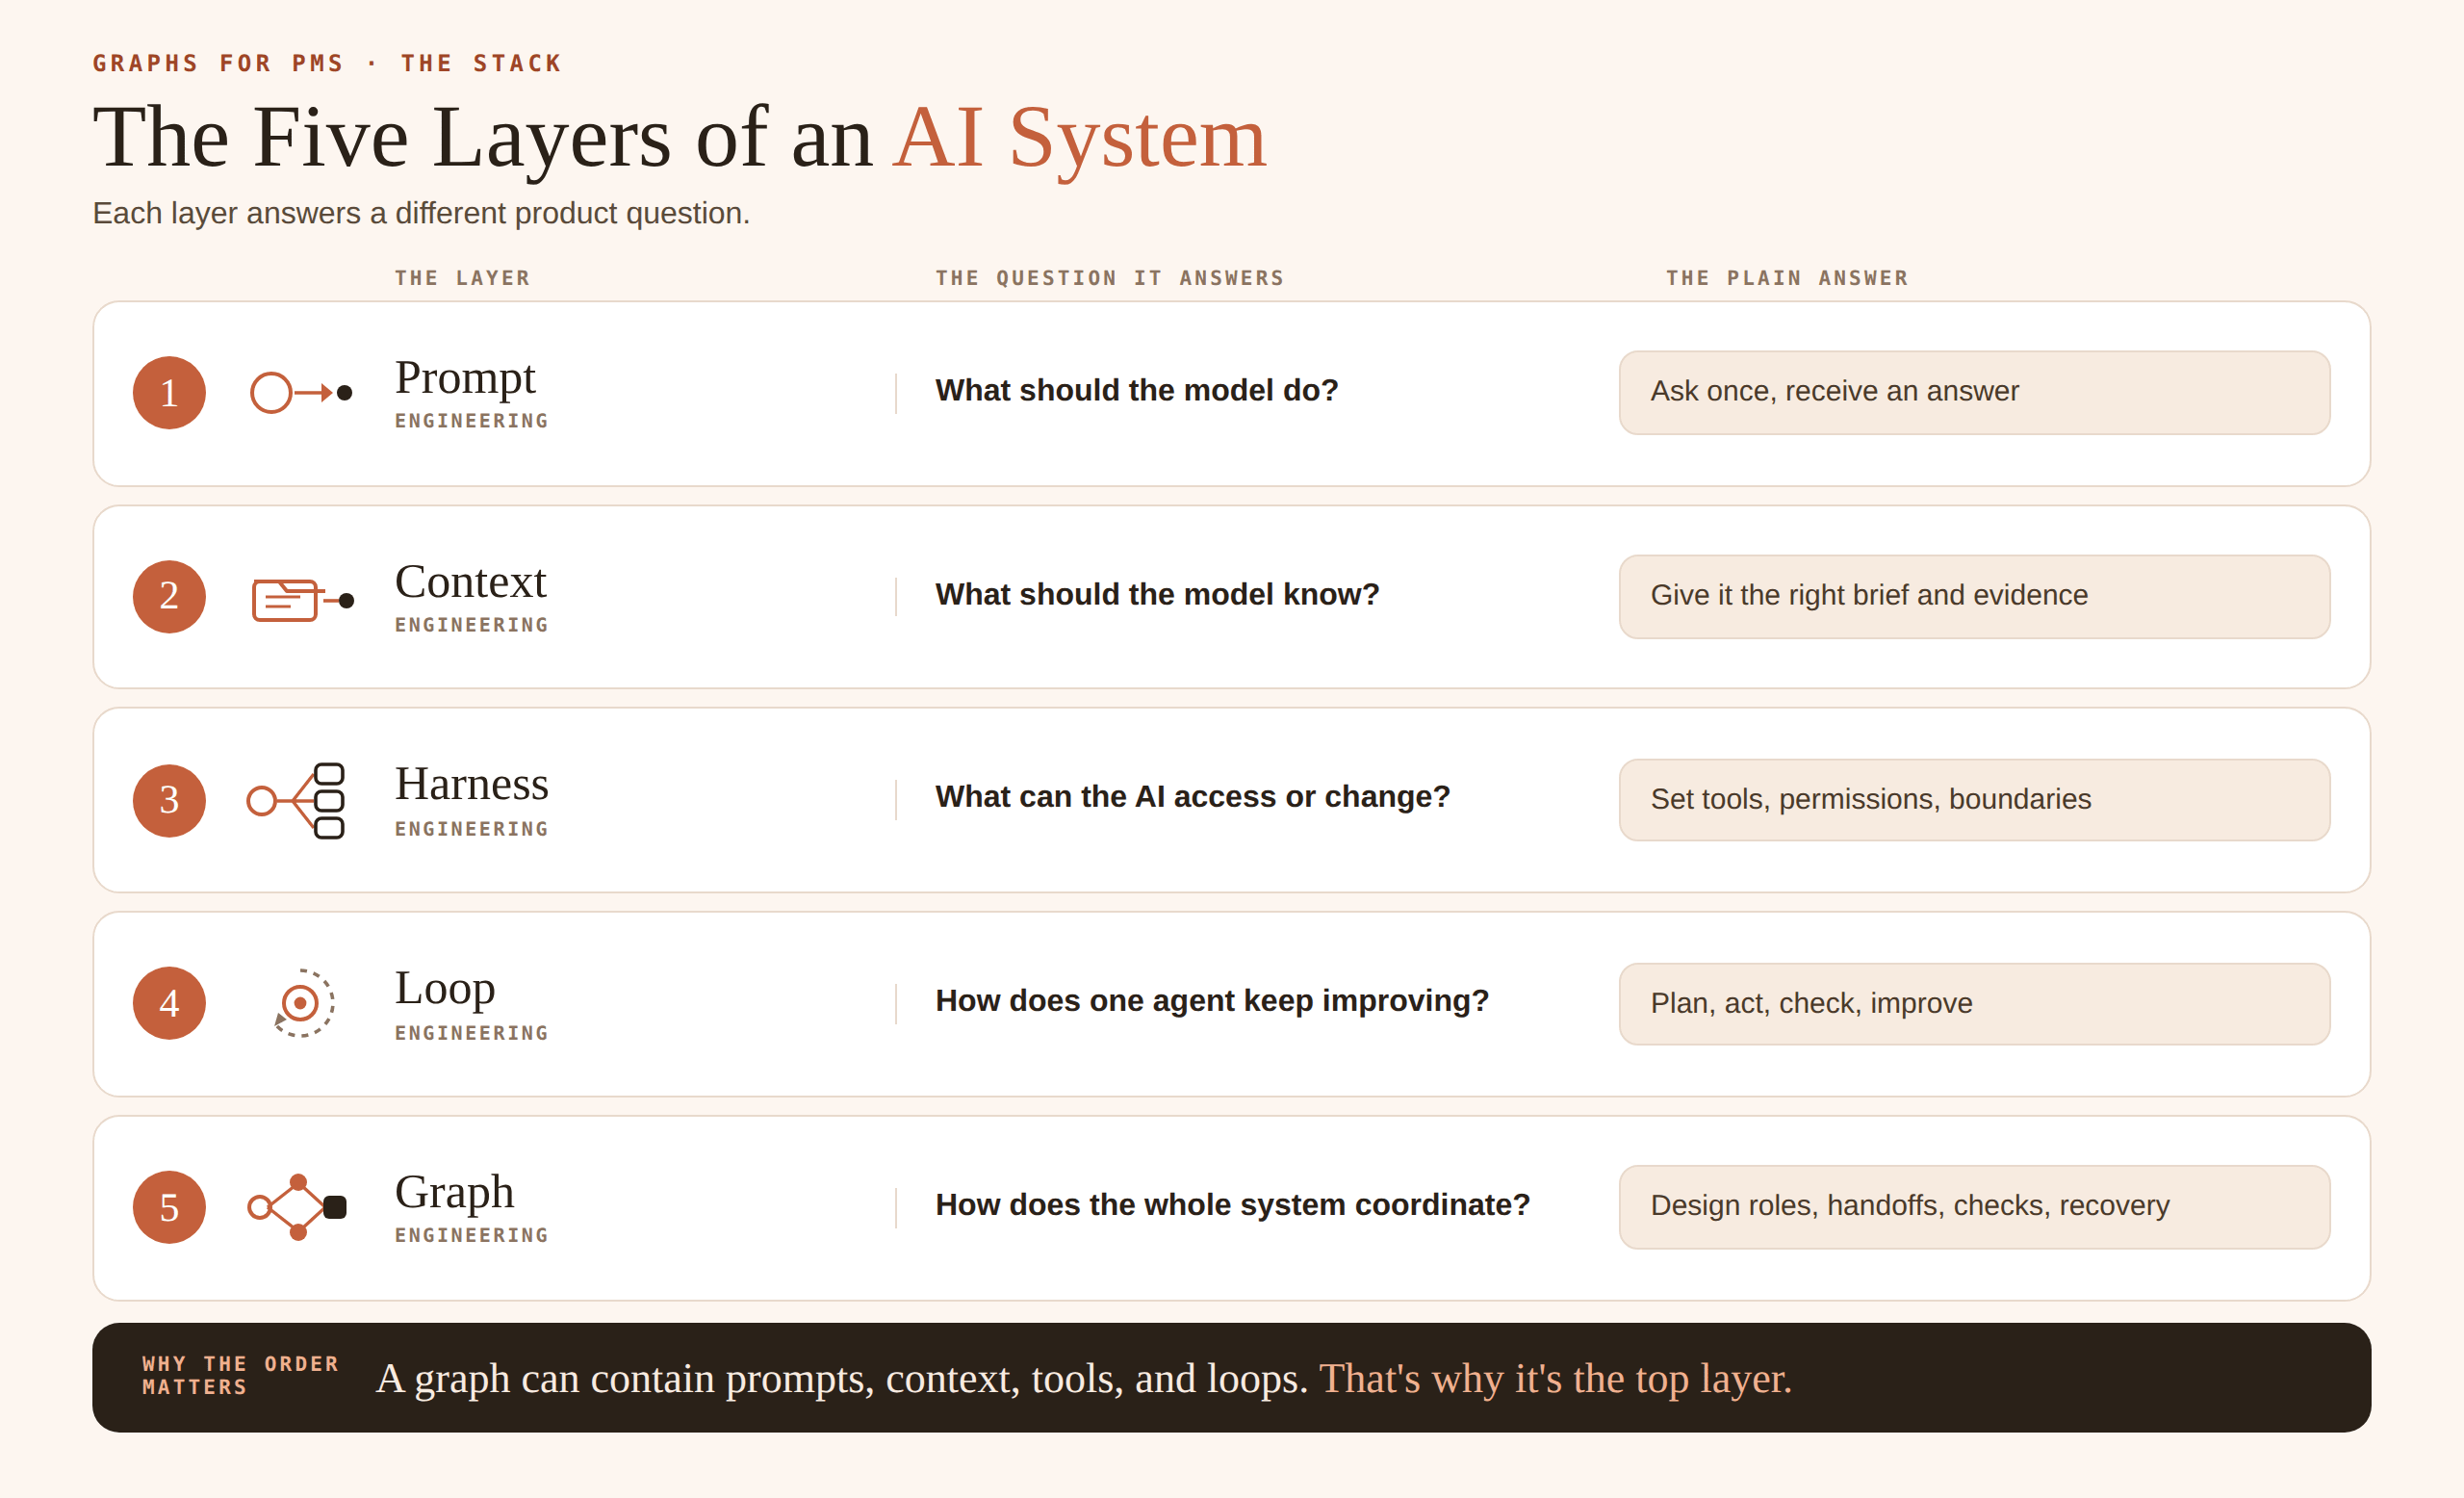
Prompt → Context → Harness → Loop → Graph
That means everything we learned in the past still matter:
Prompts define what a model should do
Context defines what the model should know
The harness is what the AI can access or change
A loop is how one agent keeps improving
Graphs are how the whole system coordinates
For simple tasks, a prompt with some context is enough. But for most high-leverage PM tasks, like writing a PRD, or a feature results writeup, you’re much better off placed with coordinating a whole graph.
(More proof on that in just a minute.)
2. The graph lego blocks to build from
Just like prompts spawned a sub-field of prompt engineering, context spawned context engineering, and harnesses spawned harness engineering, graphs have created the sub-field of graph engineering.
The best way I’ve found think of graph engineering is like putting together legos. If you learn the major pieces of legos, you can basically build anything. The same is true for graphs.
There are 5 most commonly used lego blocks:
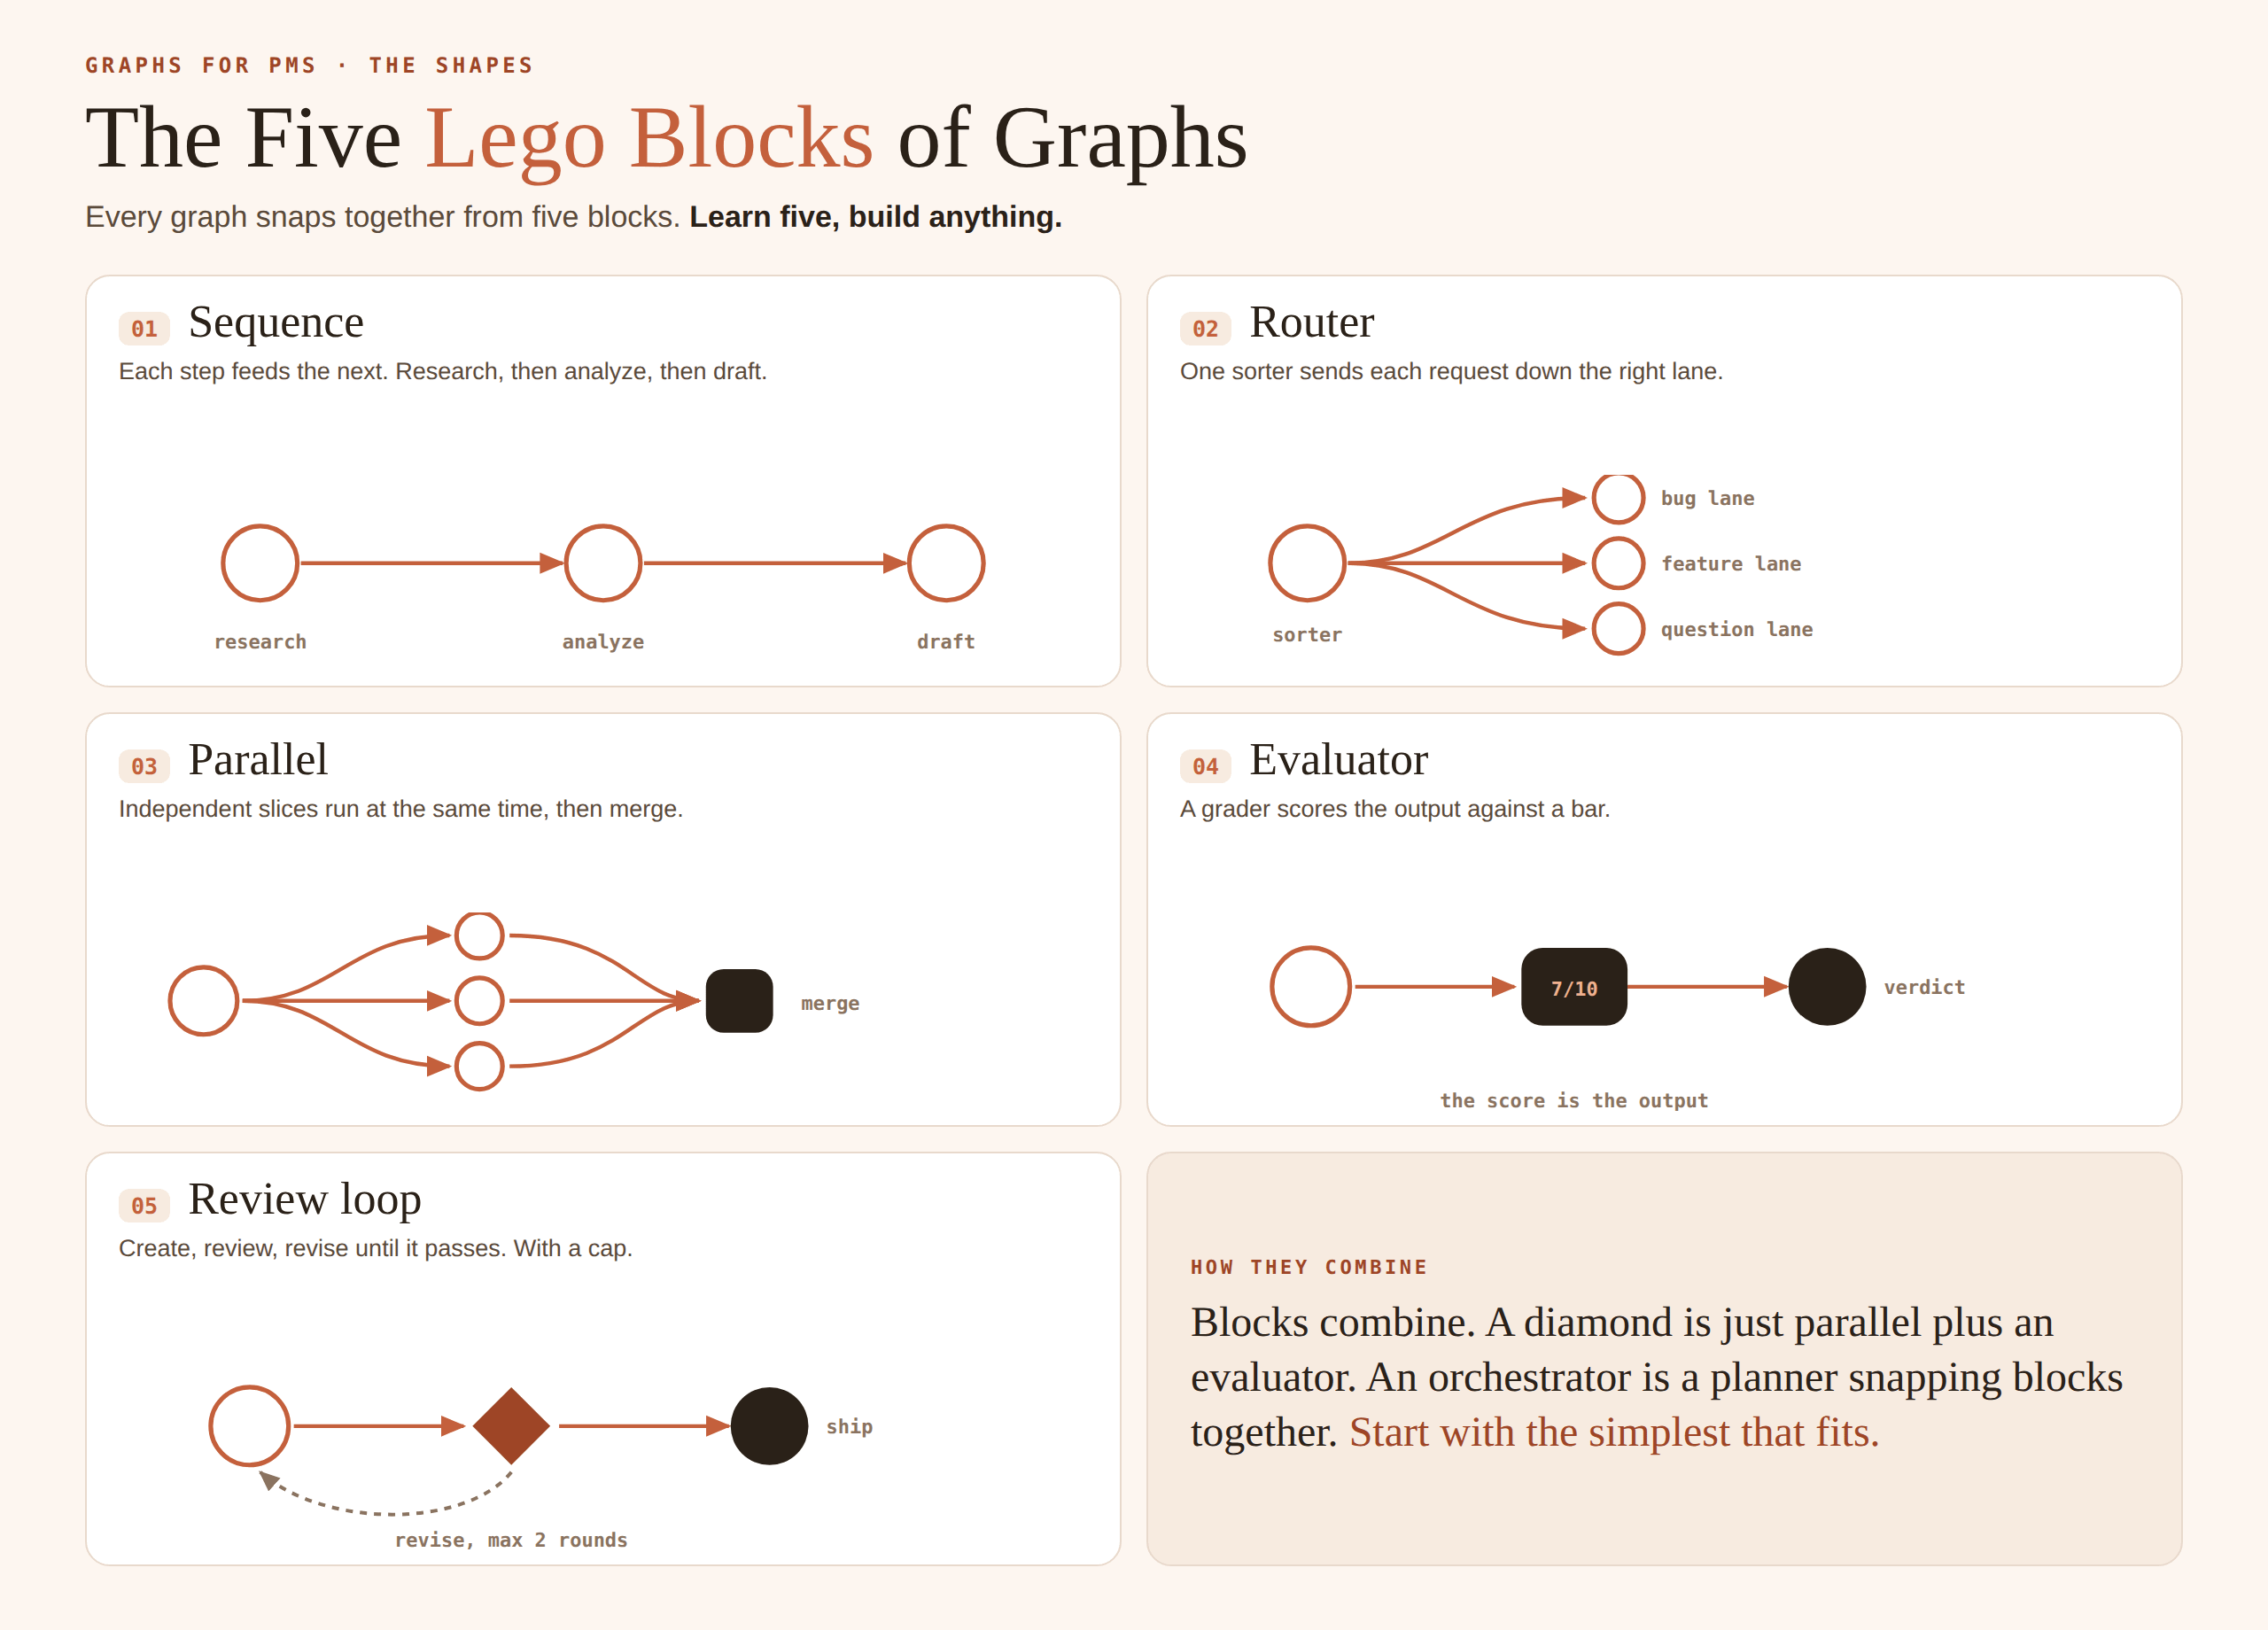
A sequence means one step feeds the next
A router sorts each request to the right lane
Parallel blocks do several things going at once
An evaluator scores the output of another agent
A review loop reviews an output till it passes a bar
You can combine in any order you’d like.
An extremely common pattern that people will build is an orchestrator + parallel + evaluator to create a diamond:
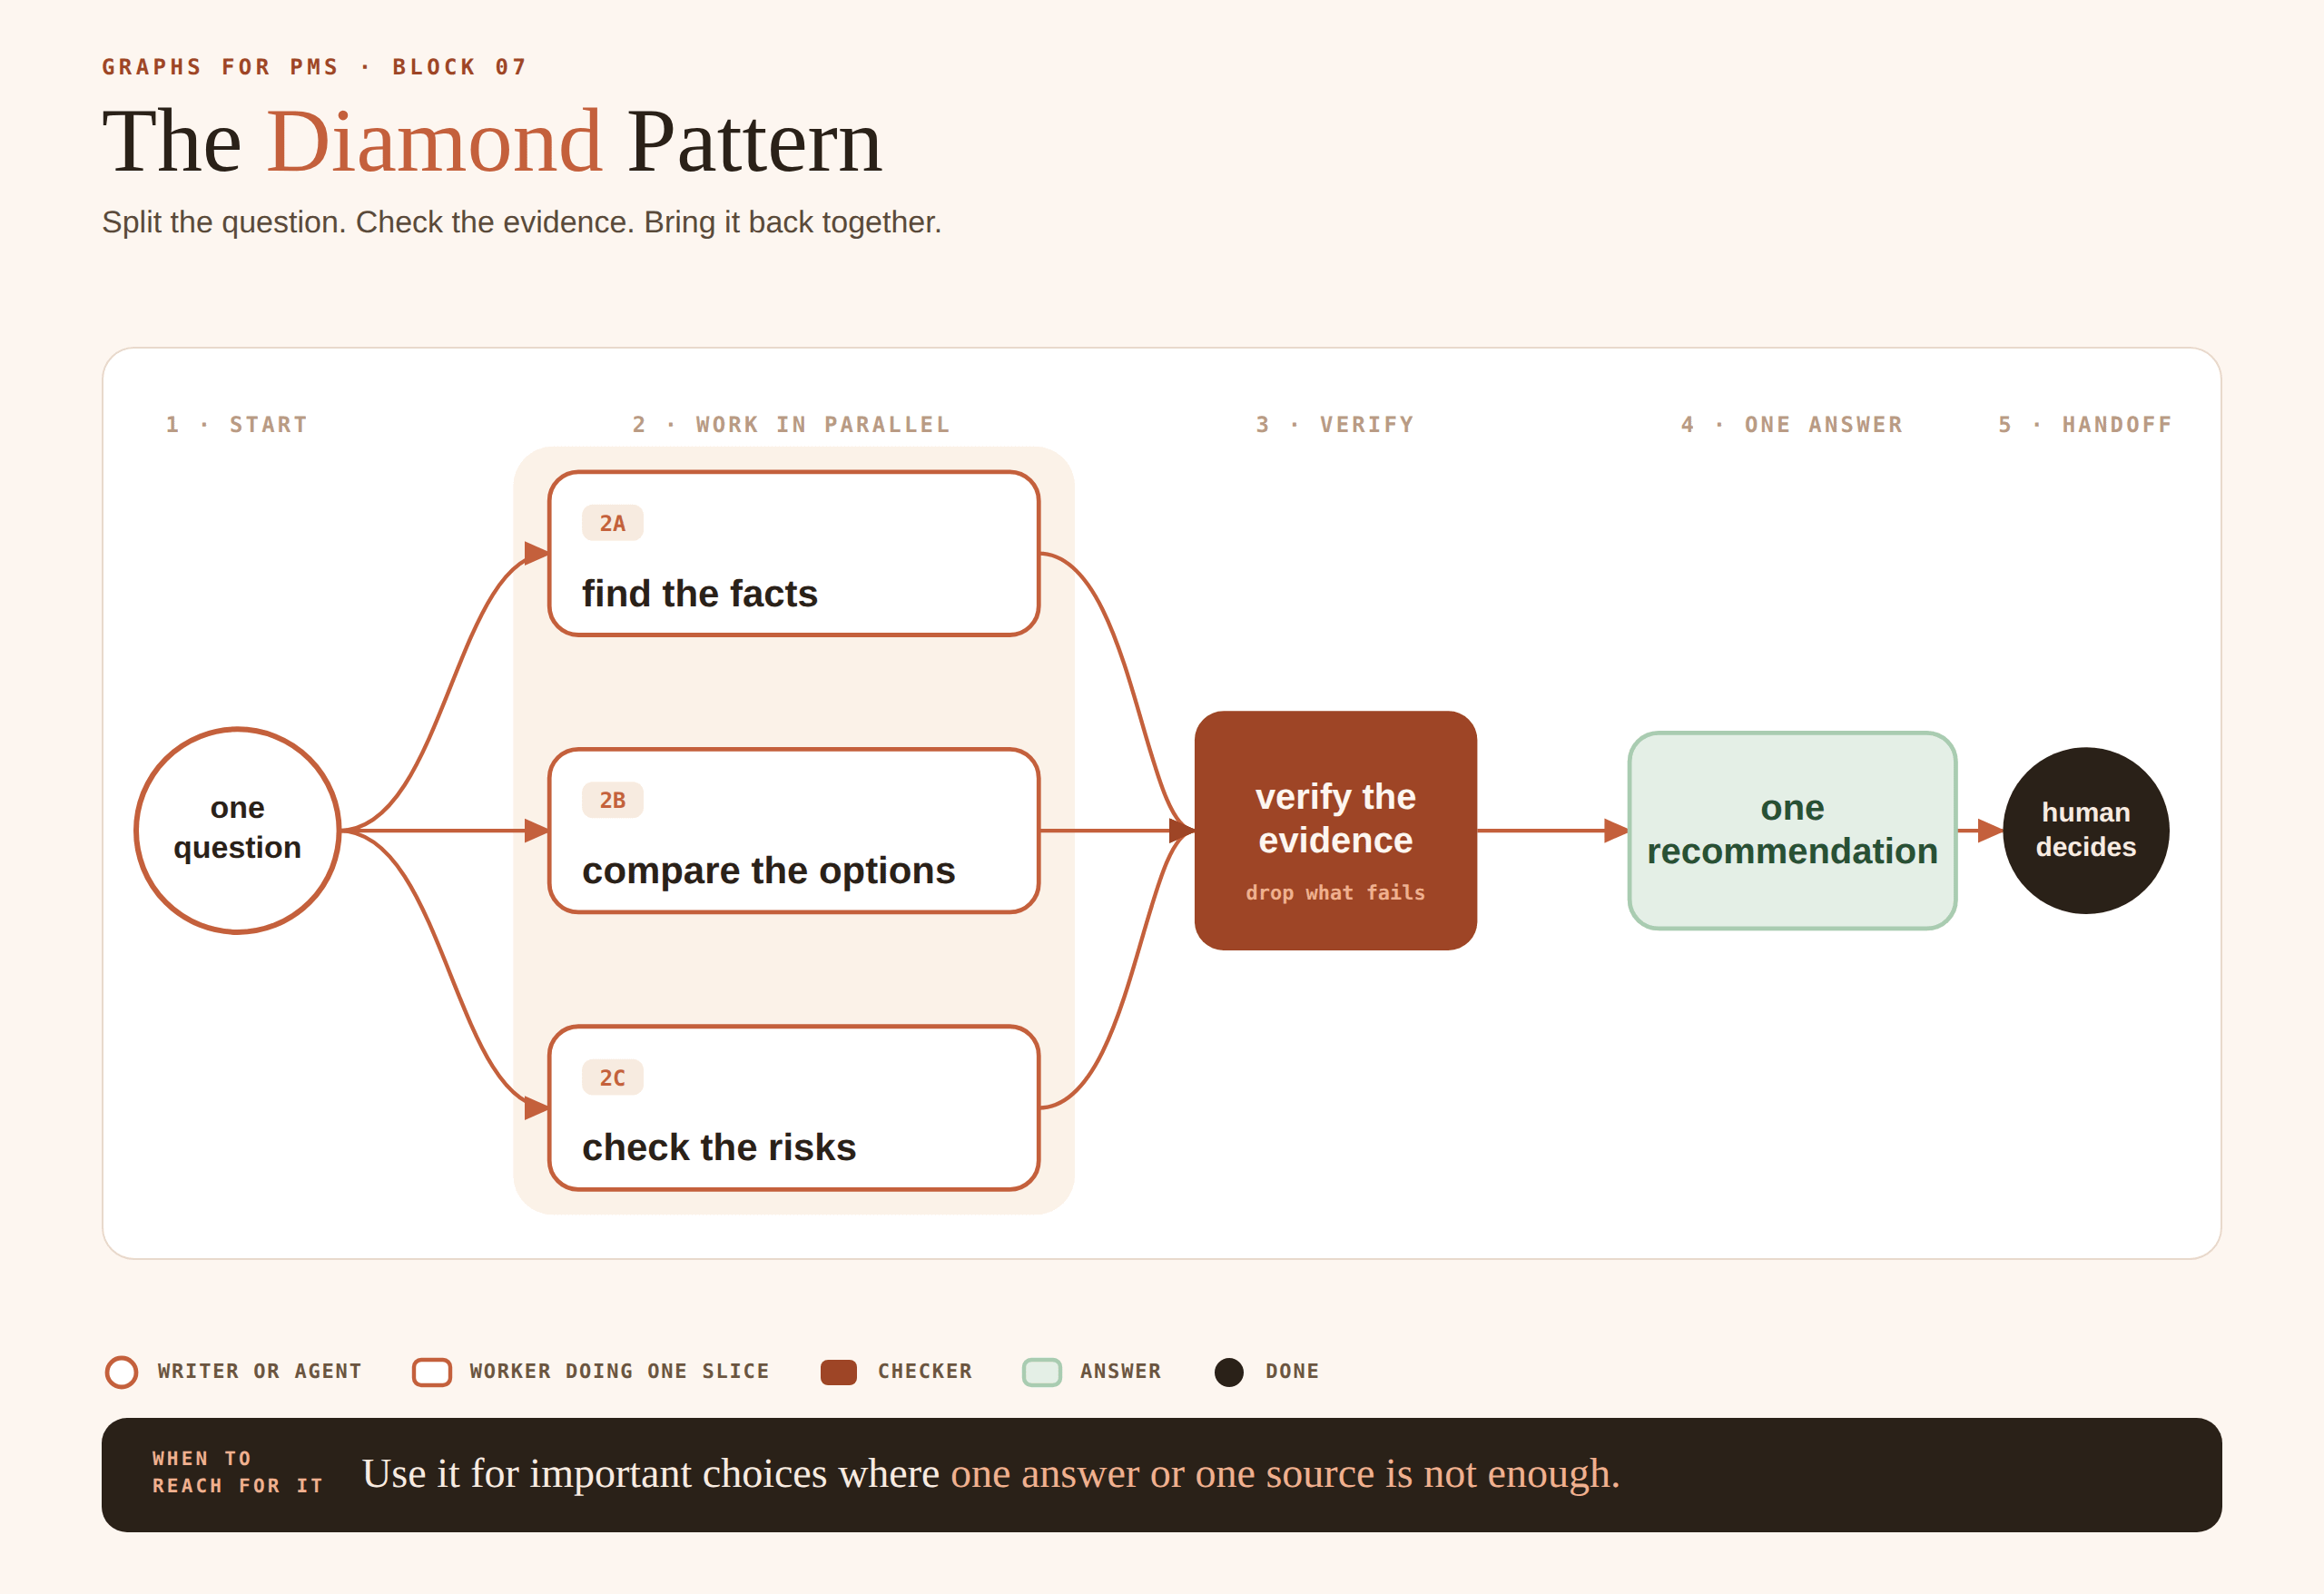
None of this is particularly new. Us software engineers were taught graphs back in college. Now, with prompting AI, they’re back.
3. Graph construction in practice
Now let’s see what this looks like in practice.
The easiest way to use Graphs is to build them with Claude Code workflows. It will even do the work of selecting the right pattern for you. Start with a prompt like this:
I want to build a PRD on a catch up module in the instagram feed.
Use workflows and parallel sub-agents to build a double diamond graph. First parallelize analytics, user research, and stakeholder meeting agents. Then write the PRD. Then run parallel adversarial sub-agents exist it to improve until each approves on a loop. Share the final for my review.
Use Fable as the orchestrator, Sonnet for easy-medium tasks, Opus for hard tasks.
The keys to this prompt are:
Define the outcome you want
Explain the graph types you want it to use (combos of the types of above)
Identify the models you want to use for each task (you can see why I use Opus so much now!)
Then you can see it will go and build the prompts and do deep work, setting up parallel workflows where possible.
You can use /workflows to manage your graphs:

We basically defined a double diamond graph:
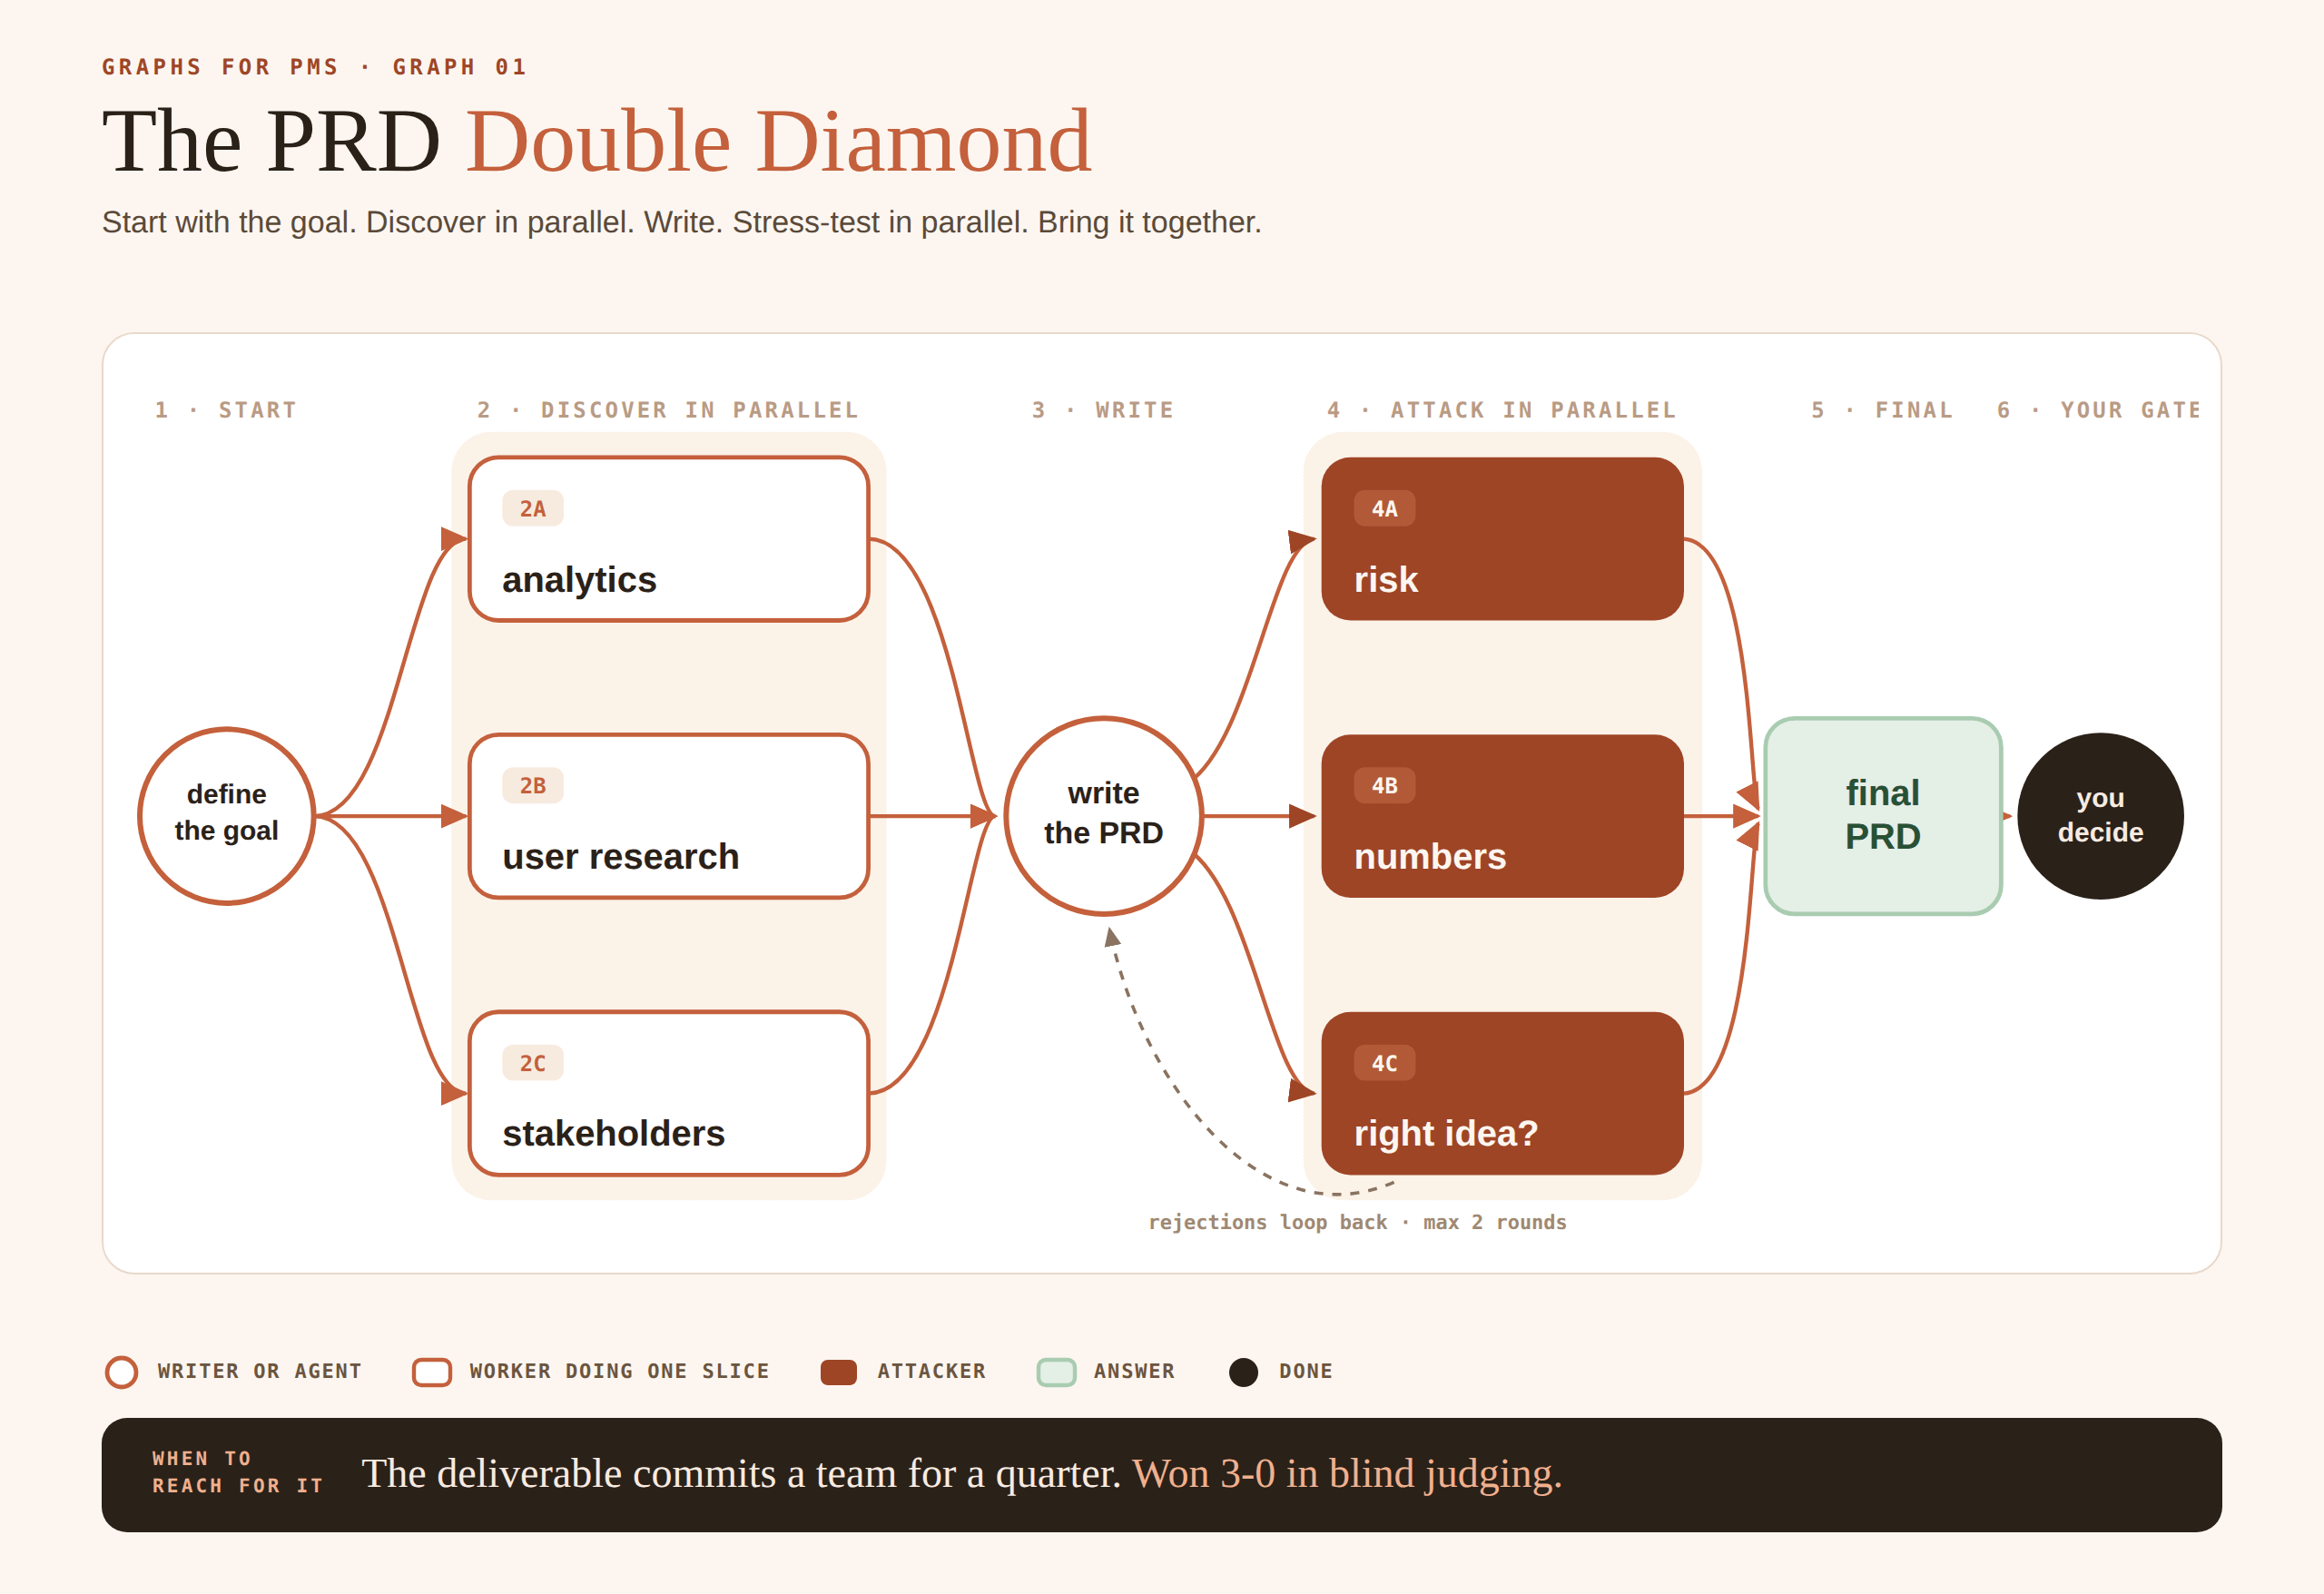
You can then monitor specific agents as they work. For instance, here’s the discover analytics agent:
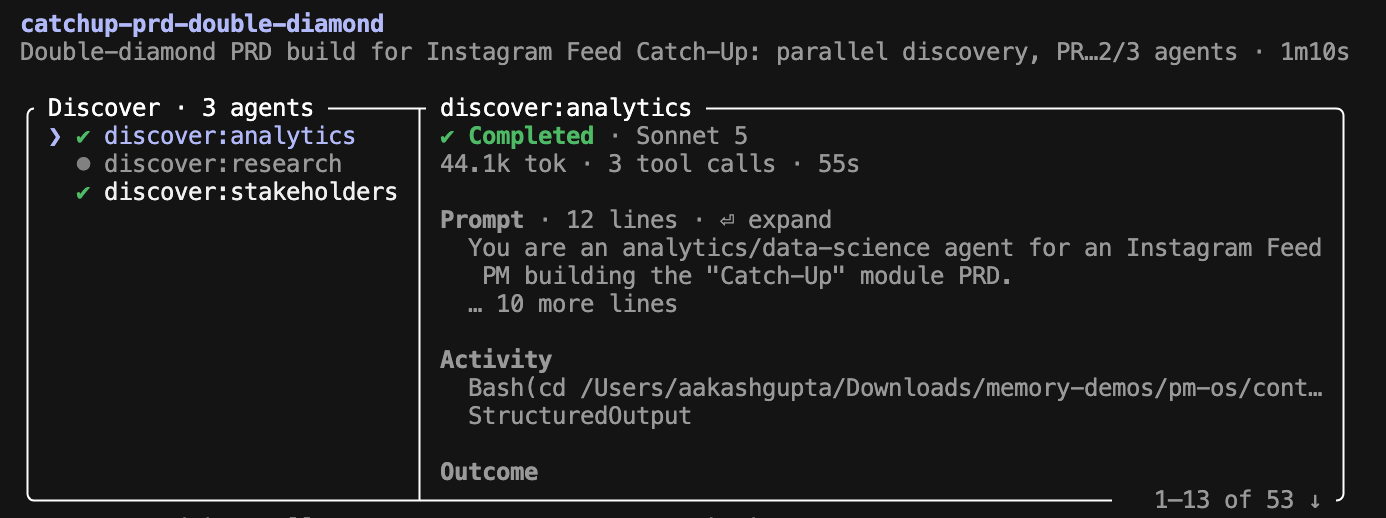
Eventually, you get an output that is the result of many agents working for you, instead of a single agent.
It’s that simple! High five. You did it.
Now onto the main course….
4. The PM graph library
So this brings up 3 really important questions :
What PM tasks deserve a complex graph?
The followup question to that is: What graph should they have?
And then: What’s the best way to prompt such a graph?
So, I used a bunch of graphs and spent 100M tokens on Fable 5 to test everything for you.
Step One - I identified 40 PM tasks are the best fits for AI
First I thought deeply: what tasks are best suited for AI out of the PM tool kit?
I found 40 tasks across 3 buckets:
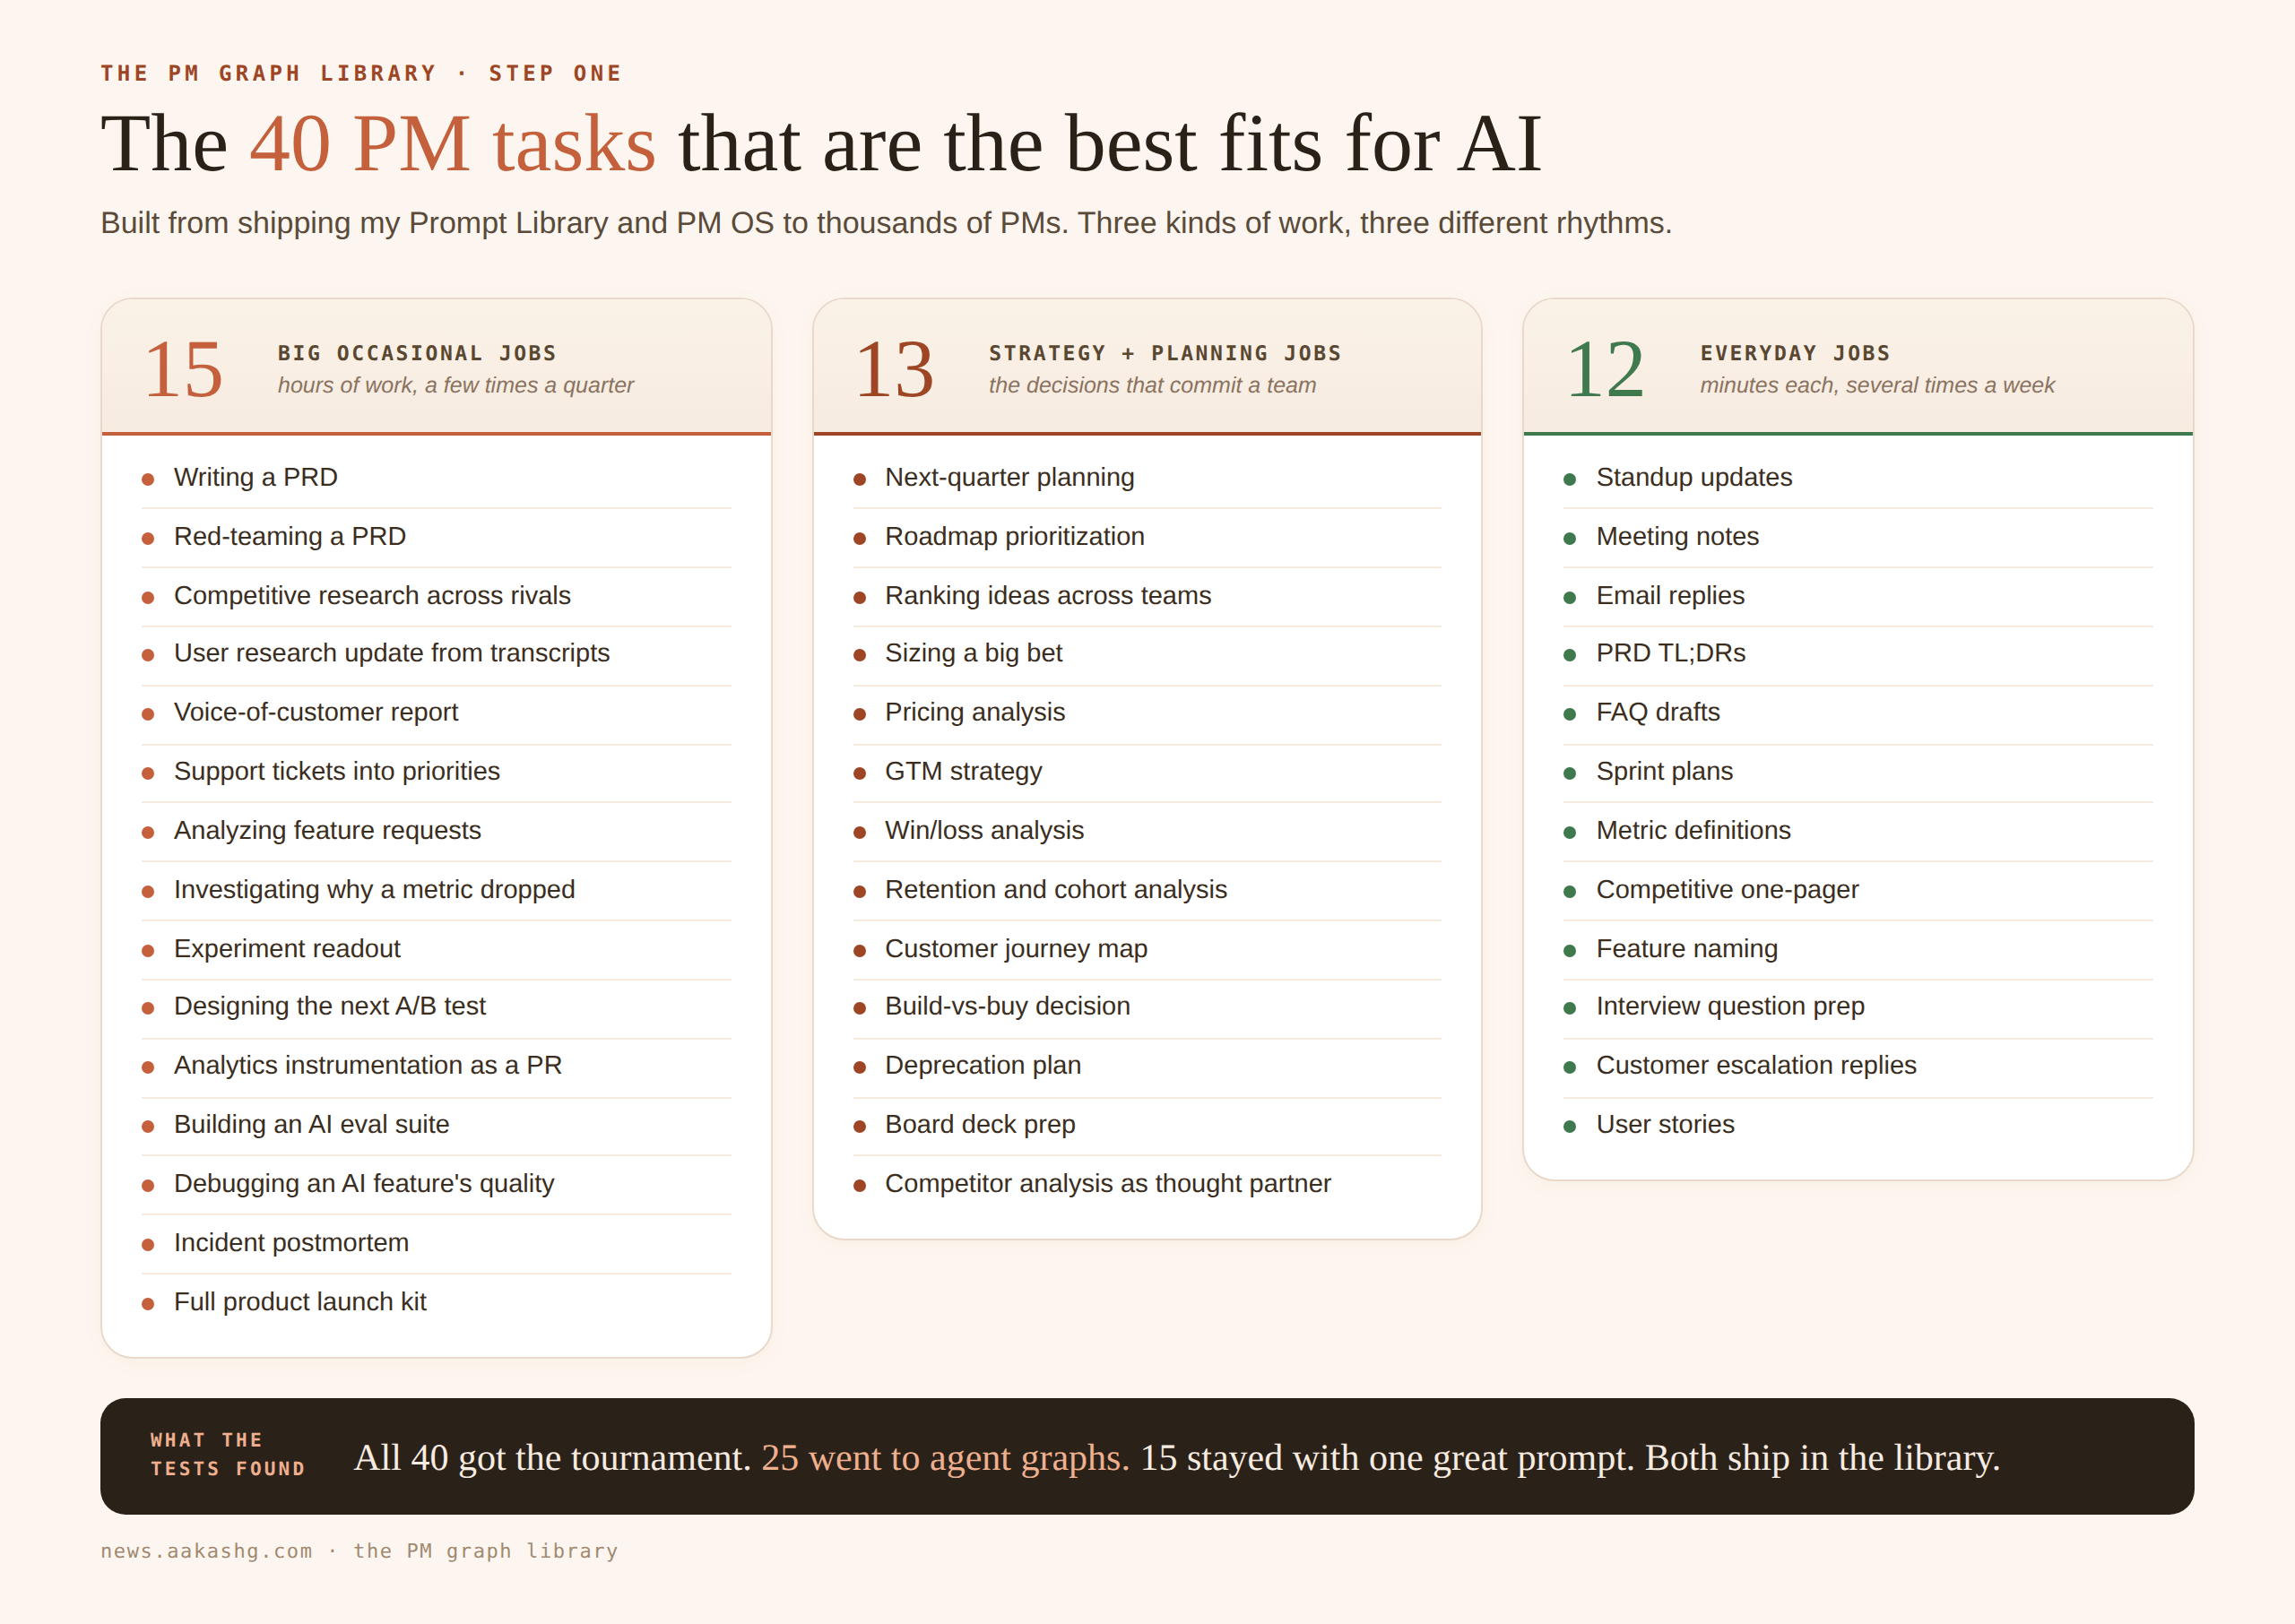
Step Two - I built the strongest simple prompt possible for each
Then I created a great simple prompt (no graph) for each of those 40 tasks (using my PM Prompt Library and PM OS).
Because here’s the principle I ascribe to:
If a graph can’t beat a great prompt, the graph is just theater.
The idea was to get the single best one-shot prompt possible.
Step Three - I built a strong testing environment
Then I built an environment to test multiple graphs vs simple prompts.
I built a PM OS for a hypothetical PM at Instagram. It had everything: templates, files, even MCP connections.
But I didn’t make it “clean.” I planted issues:
An action item that got canceled 20 minutes later in a meeting transcript
A research claim marked “UNVERIFIED, do not cite”
A sprint that overbooked an engineer on PTO…
Step Four - I ran the tests on the best graphs
Then I went about testing the simple prompts vs graphs. But I didn’t use any graphs.
I theorized about the best graph construction for each type, and tested up to FOUR structurally different graphs for each use case.
Three independent graders graded the simple + 4 graph outputs.
Graphs ultimately won 25 of 40 tasks. These 12 were the biggest winners:
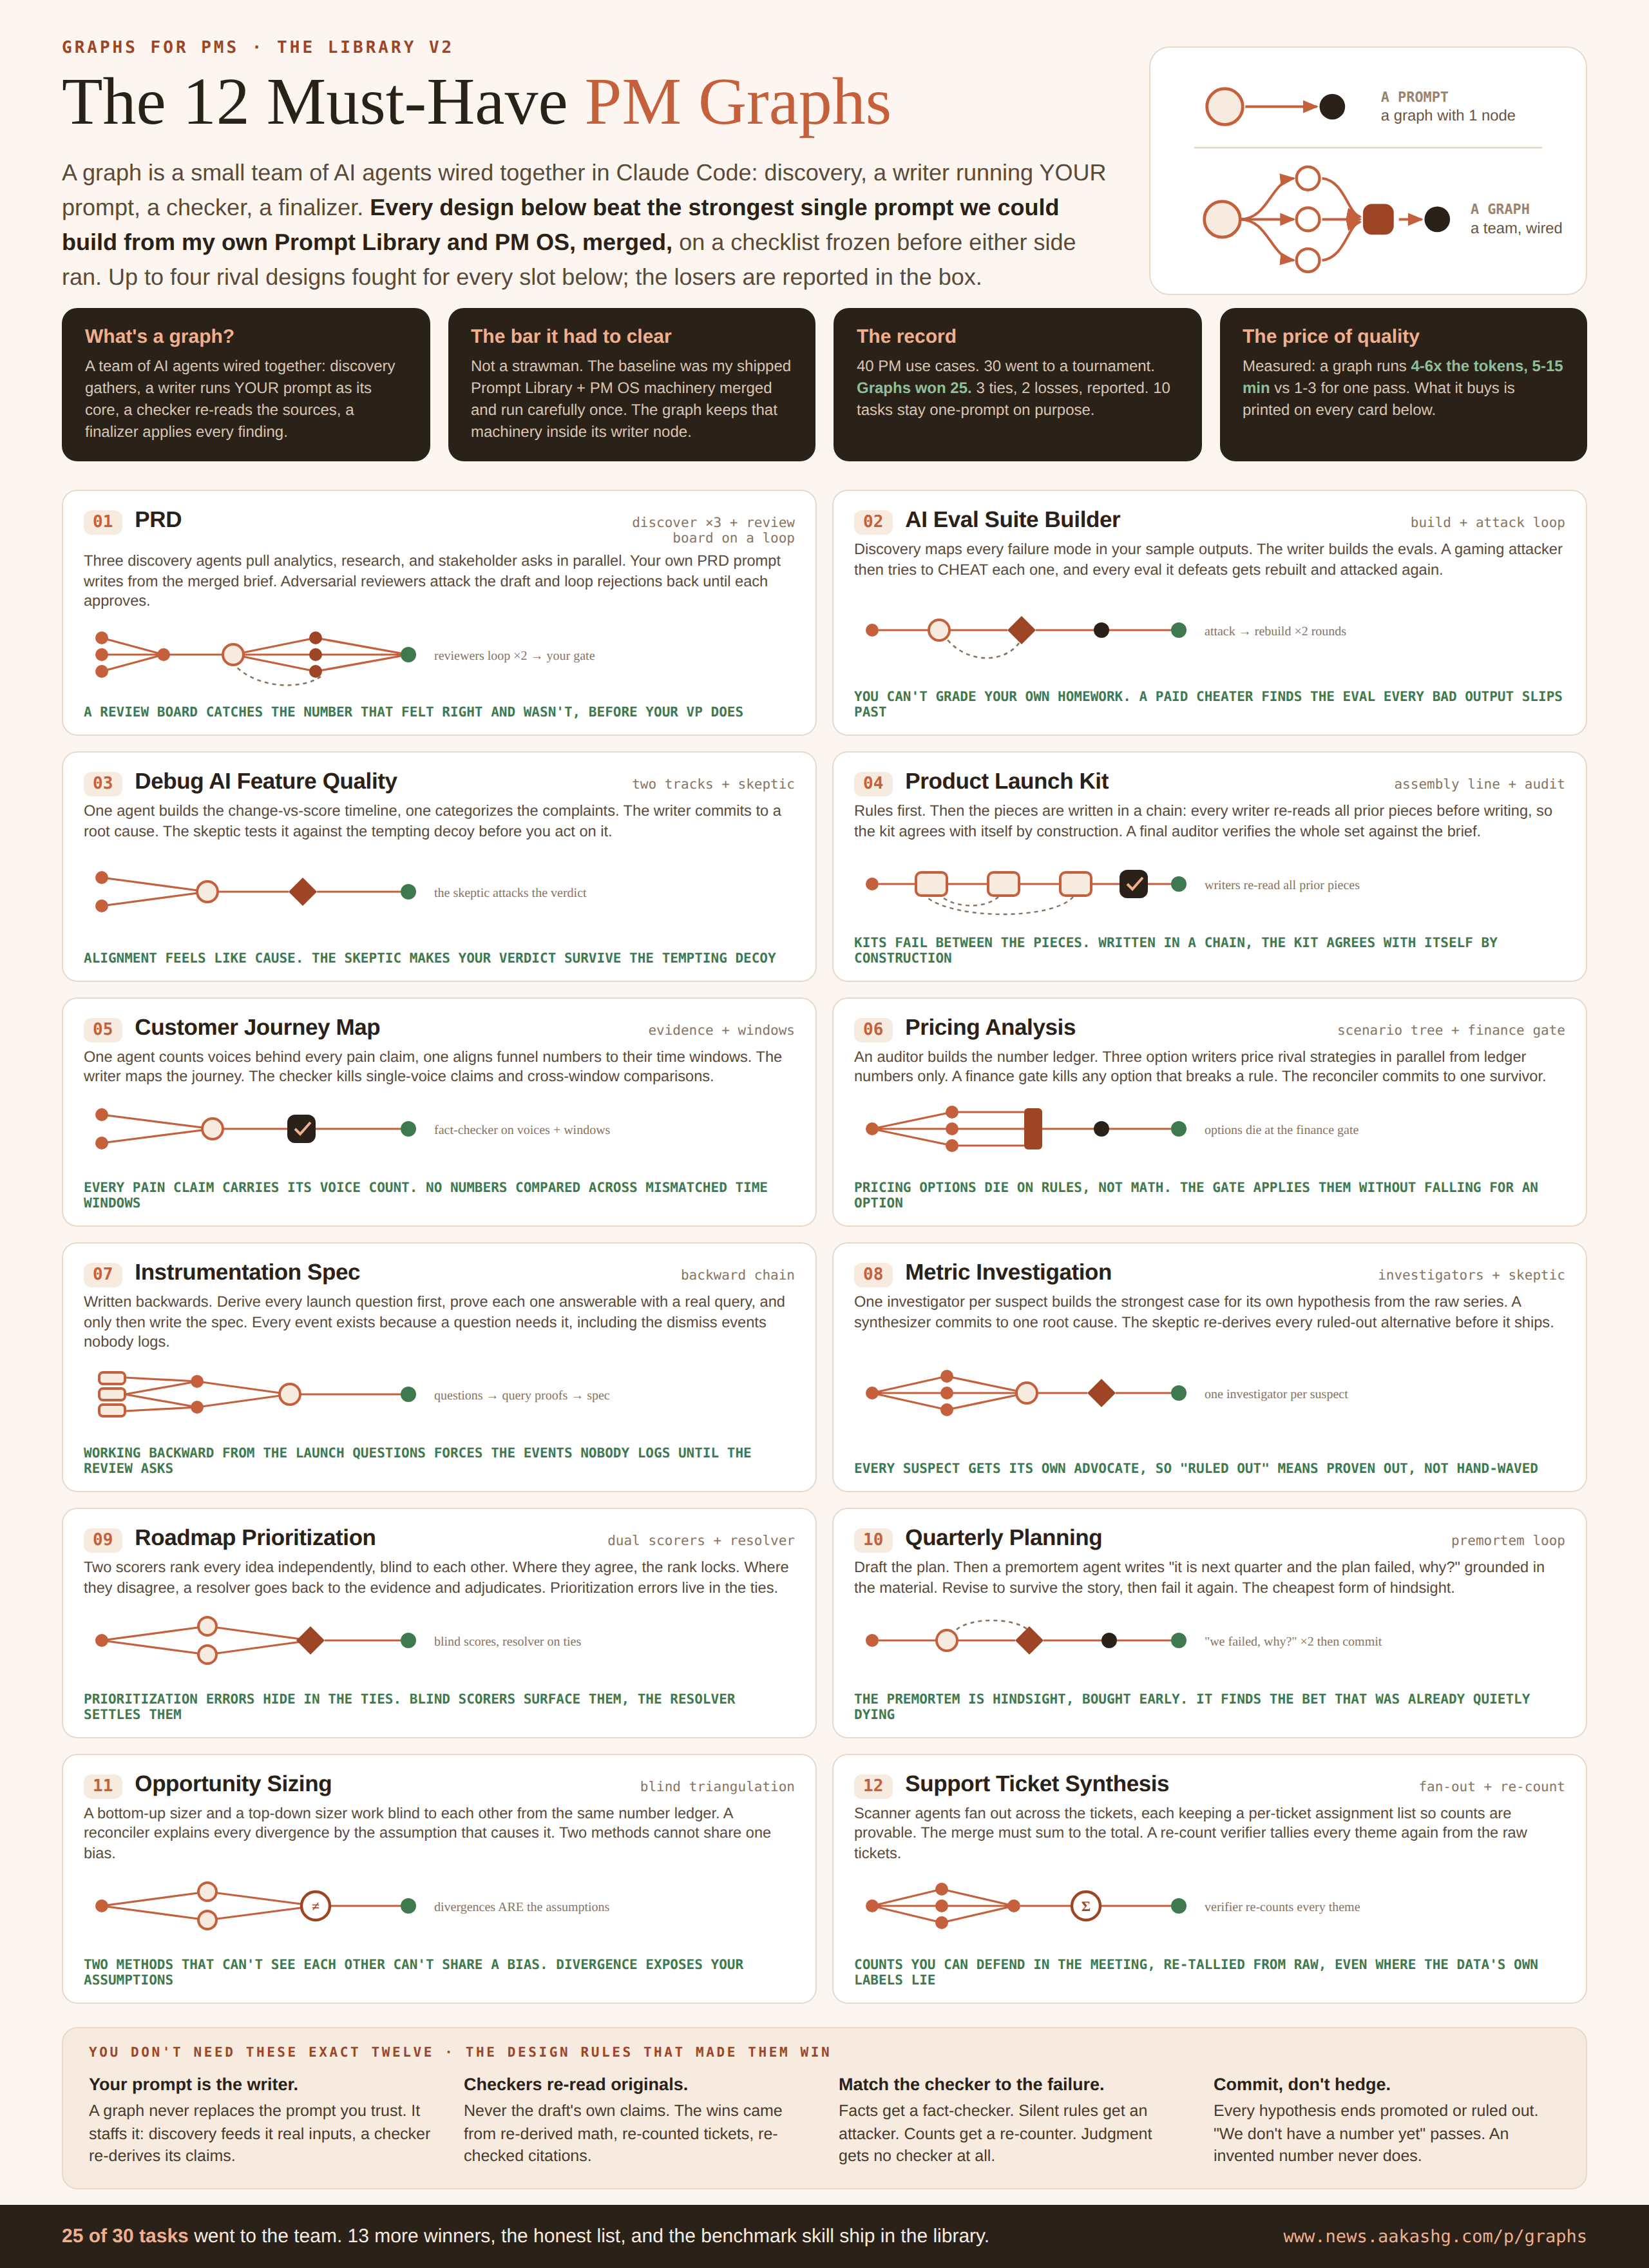
That’s the essence of graph engineering. Find the tasks, write the graphs, test the results.
That covers today’s paid newsletter.
I also wanted to give you more than a newsletter today.
I’ve put all 25 graph winners, plus the winning 15 simple prompts, into the PM graph library.
Plus, I’ve created a skill that scans your entire repo for tasks and prompts, runs the graph engineering on them, and hands you updated prompts.
You have two options to get the package:
Buy the product on Gumroad for $49
Upgrade to a paid subscriber and you’ll be able to download it below: