
I Asked LogRocket and PostHog the Same 10 Questions About My Site. Here's What Their AI Got Right and Wrong.
TL;DR
I scored both tools on 10 real questions about my Bolt-hosted site (landpmjob.com) using a correct / complete / hallucination / overall (1–5) rubric. Final scores: LogRocket Galileo 47/50. PostHog Max 28/50.
LogRocket won decisively on the debugging questions. Galileo found 5 distinct rage-click hotspots across 24 sessions and traced all of them back to a single React hydration mismatch. It ranked Minified React errors #418/#423 by user impact (~47% of users), tied them to specific broken UI elements, and mapped them across browsers and geos. PostHog returned zero exceptions and found 1 rage click on the wrong element.
PostHog held its own on three questions, all scored as 4/4 ties: Q3 (a clean session-019ddf98 forensics narrative), Q9 (a sharper funnel viz with median time-to-step), and Q10 (tighter mobile-vs-desktop recommendations).
1. Why I ran this eval
Every session-replay vendor now ships an “AI insights” feature. None of them publish how those features actually score on the questions a PM would ask in a Monday standup. So I scored them.
I run AI evals as part of my day job. The method that works on internal model outputs works on vendor AI features too: define the questions, define a rubric, run the prompts, score the answers, publish the work. The reason to do this for session replay specifically is that the cost of a wrong answer is high. A hallucinated rage-click target or a missed JavaScript error can actually send a roadmap in the wrong direction.
Disclosure. LogRocket sponsors my podcast and newsletter. I told them upfront that I’d publish whatever I found, including anywhere PostHog won. PostHog had no involvement in this post and didn’t see it before publish. The 10 questions and the rubric were locked before I opened either tool. The scoring was done with the answers in front of me side-by-side, and I tried to keep the tool labels off the page while I scored. If anything in here reads like marketing, that’s on me, not on either vendor.
2. The setup
The site under test is landpmjob.com. It is a Bolt-hosted landing page for my PM job-search product. Real traffic, real users, no sandbox. Over the 30-day window, the tools captured roughly 30 sessions: a mix of mobile (iOS Safari, Chrome Android) and desktop (Chrome on Mac), with traffic from the US, India, the UK, and Brazil.
Both SDKs were installed in parallel via a <script> snippet in <head>. LogRocket auto-captures sessions and exceptions by default. I did not build custom dashboards on either side. I did not write SQL on the PostHog side. I did not prompt-engineer the questions for either tool. Each question was pasted in verbatim, once, and the first answer is what I scored. That’s the bar a real PM hits on a Monday morning.
3. The 10 questions and the rubric
I picked questions a PM would actually ask. The kind that come up when traffic dips, when an exec asks why pricing isn’t converting, or when an engineer pings you about a possible regression.
The 10 questions, asked verbatim of each tool:
What is the most common path users take from landing on the homepage to leaving the site?
Where do users hesitate or pause the longest before taking an action? Cite a specific session.
What did this specific user do in the last 30 seconds before they bounced?
Which CTAs or buttons get the most rage clicks or dead clicks across all sessions?
Are there any JavaScript errors or failed network requests in the last 24 hours? If yes, which page and how many users hit them?
In this session, did the user encounter a broken UI element, layout shift, or unresponsive control? Show me the timestamp.
What is the highest-impact bug right now, ranked by how many users it affected?
What percentage of users who land on the homepage scroll to the pricing or CTA section?
Of users who clicked the primary CTA, what percentage completed the next step? Where did the rest drop off?
Compare mobile vs desktop conversion on the main funnel. Which converts better and where does the weaker one leak?
The rubric, scored 1–5 per dimension, with a single overall score per question:
Correct. Did the answer match ground truth I verified manually in the raw session data?
Complete. Did it answer the full question, or only part of it?
Hallucination. Did it invent sessions, numbers, or behavior?
Overall (1–5). Would I act on this answer in a standup?
The overall score is the one I report. Correct/Complete/Hallucination are the diagnostic columns that explain why a question scored where it did.
4. Question-by-question results
The headline number: LogRocket Galileo 47/50, PostHog Max 28/50.
The full breakdown:
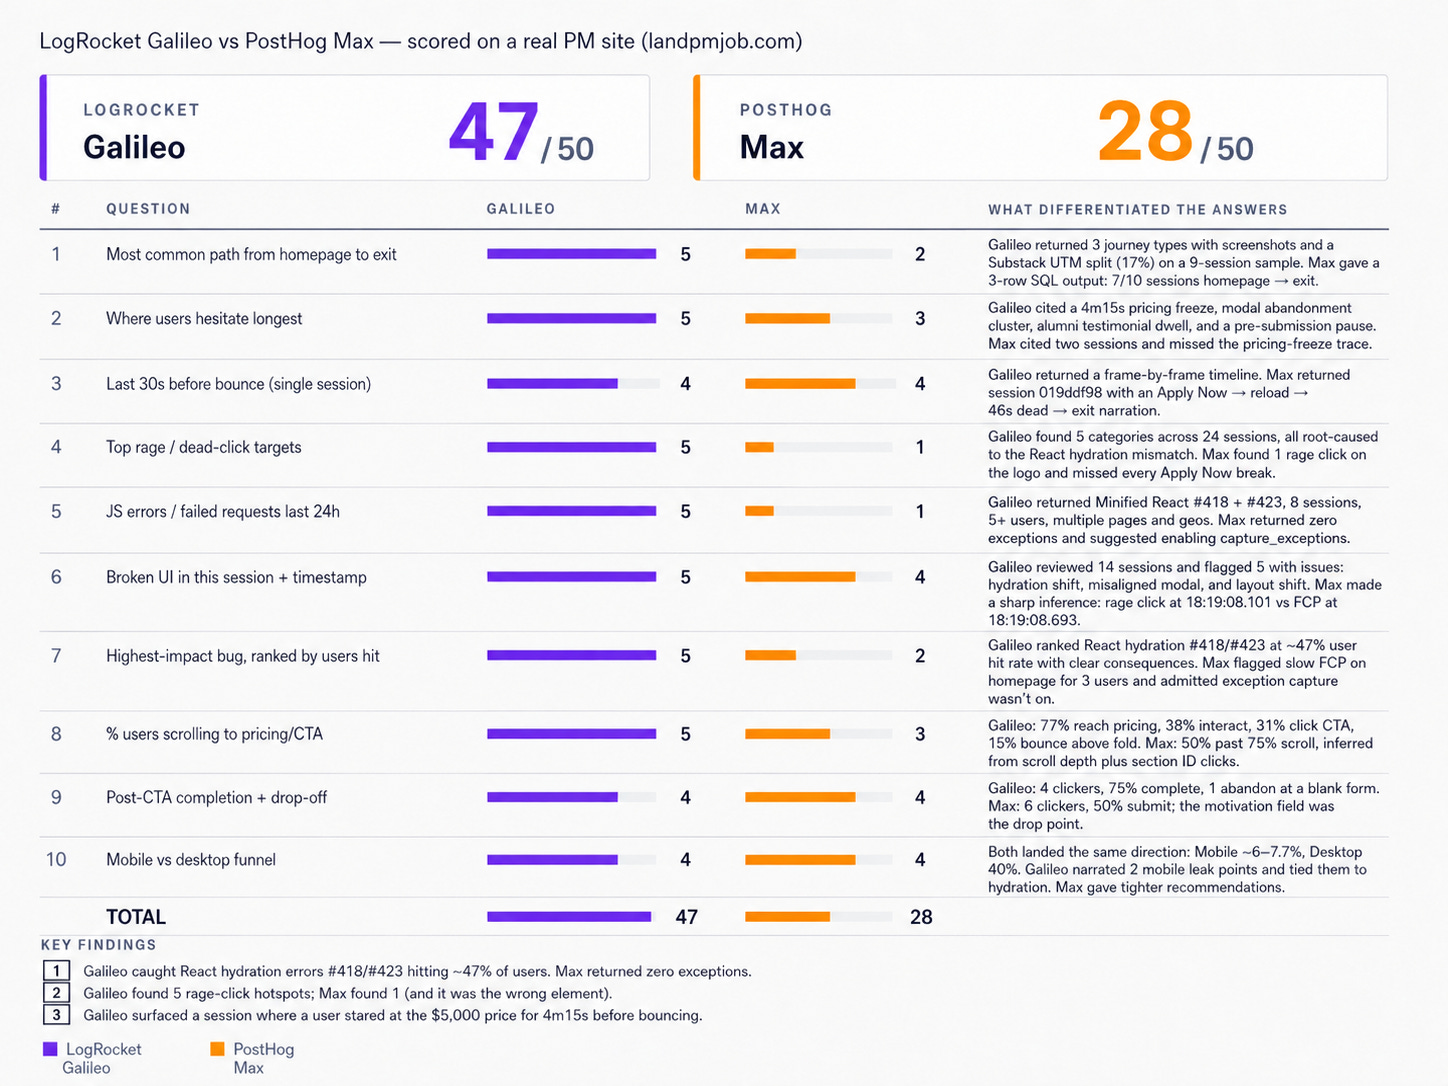
A 19-point gap is large, but it’s not evenly distributed. Three questions - Q4, Q5, Q7 - drove most of it. All three are places where the answer depends on connecting signals across sessions, not just reporting them individually.
5. Where LogRocket won
Three concrete wins, in priority order.
Q4 - rage and dead clicks.
Galileo surfaced 5 distinct hotspots across 24 sessions: header Apply Now, pricing-card Apply Now (clicked across 3 region tabs with no response), the modal submit button, FAQ accordion toggles, and the newsletter popup close. It then traced all 5 back to the same React hydration mismatch from Q5. Five symptoms, one root cause, found automatically. PostHog returned a single rage click on an <h1> logo, the wrong target. This gap has nothing to do with capture_exceptions config. It’s cross-session pattern recognition. If you’re a PM trying to triage frustration, one tool gave you a prioritized list with a unifying diagnosis and the other gave you a false lead.
Q5 and Q7 - bug detection and prioritization.
LogRocket Galileo identified Minified React errors #418 and #423 as the highest-impact bug on the site, hitting 8 sessions across 5+ users in 24 hours, breaking Apply Now buttons, FAQ accordions, and the newsletter popup close. It didn’t just capture the exceptions. It ranked them by user-facing consequences (broken Apply Now buttons, FAQ accordions, newsletter popup close), tied them to specific pages, browsers, and geographies, and connected them to the rage-click patterns from Q4. PostHog returned zero exceptions for the same window because capture_exceptions is opt-in. But even if it had captured them, the ranking and cross-referencing is where Galileo pulled away.
Q2 - product insights.
Galileo found a session where a user stared at the $5,000 pricing page for 4 minutes and 15 seconds before bouncing. That’s the kind of finding that gets a pricing-page redesign greenlit. It surfaced a customer experience problem I didn’t know I had, without being asked to look for it. PostHog missed it entirely.
The questions LogRocket won are the ones where the answer depends on connecting signals across sessions: grouping rage clicks back to a root cause, ranking bugs by who they hurt, surfacing the session that rewrites a product decision.
6. Where PostHog held its own
Sponsor or not, this section has to be honest, or the rest of the post doesn’t hold up.
Q3 - Concrete session forensics.
Both tools handled this one well and both scored 4/5. PostHog Max returned session 019ddf98 with a tight narrative: the user clicked Apply Now, reloaded the page, then sat idle for 46 seconds before exiting. LogRocket’s answer was richer, a frame-by-frame timeline with screenshots from a Mobile Safari session in New Delhi, but PostHog’s reload-and-stall sequence was the kind of detail you’d paste straight into a bug ticket.
Q9 - Funnel visualization.
PostHog Max built an actual funnel chart with conversion percentages and median time-to-step, flagged the motivation field as the drop point, and rendered it cleanly. LogRocket’s answer was a narrative, but not as immediately roadmap-ready. For a PM building a quarter plan, a funnel viz with a flagged drop step is more directly usable than a paragraph.
Q10 - Tighter recommendations.
Both tools landed the same directional finding (Mobile ~7.7% / Desktop 40% conversion) and both scored 4/5. The split was on packaging: PostHog’s recommendation list on what to simplify and where to test was shorter and more actionable than LogRocket’s narrative. If you’re triaging weekly funnel reports, that compactness matters.
The pattern: PostHog kept up on planning and individual-session questions where the answer is well-defined. LogRocket pulled away on debugging questions, where seeing the bug at all is the whole game.
7. Honest take — who should pick which
Pick LogRocket if your team’s primary use case is debugging frontend issues, your PMs and engineers share the same tool, and you want session-level narrative answers with embedded screenshots. Galileo connects signals across sessions: it groups rage clicks to a root cause, ranks bugs by user impact, and surfaces the pricing-anxiety session you didn’t know to look for. All of that on day one with zero config.
Pick PostHog if you want session replay bundled with product analytics, your team writes its own queries, and you care more about funnel and cohort depth than about frontend exception coverage. If your engineers are willing to flip capture_exceptions: true on day one, the gap on Q5/Q7 narrows.
Pick both if budget allows. They answer different question types and the overlap is smaller than the marketing suggests.
My choice for landpmjob.com: LogRocket. The site’s biggest open problem is broken interactions on a frontend-heavy Bolt build, and Galileo is the only tool of the two that connected 5 separate rage-click hotspots back to the React hydration bug eating ~47% of my users, ranked it by impact, and surfaced a pricing-anxiety session I didn’t know existed. For me, on this site, that’s the deciding question.
8. Methodology limits and what I’d test next
A few caveats I want on the record:
Single site, small traffic. A site with 100K MAU might surface different AI strengths on both sides - particularly around cohort analysis, where PostHog has more room to flex.
One evaluator. I scored the answers myself. Inter-rater reliability isn’t tested. If you score the same answers with a different rubric weighting, the gap could narrow or widen.
Out-of-the-box only. Both tools likely improve with tuning. PostHog would almost certainly score higher on Q5 and Q7 with
capture_exceptions: trueset before the eval window. But the biggest gaps (Q4’s cross-session pattern recognition, Q2’s pricing-anxiety surfacing) aren’t config issues.Single point in time. Both teams ship AI updates monthly. This eval is a snapshot.
What I’d test next: same rubric on a B2B SaaS app with auth flows, run with 3 PM evaluators, scored after 30 days of intentional tool tuning on both sides.
The 10 questions and the rubric are above. If you run them on your own site, send me your scores, and I’ll publish the comparisons.