
How to Measure Onboarding: Advanced Topics in Activation Metrics
There are plenty of basic guides to onboarding out there. But if you’re practicing onboarding day in and day out, you know you need a nuanced more picture. Here it is
Onboarding often feels like a side task for growth teams.
But it’s not.
It’s foundational—whether you’re scaling a feature, launching a 0-to-1 product, or improving retention.
In fact, onboarding is the engine behind long-term product success.
Yet, the hardest part isn’t designing onboarding flows or writing tooltips. It’s figuring out the right metrics to measure success.
That’s where people trip up.
Introducing Ramli John
So today I’ve partnered up with Ramli “RJ” John, who is one of the people who has spent the most time in the world on onboarding.

He’s the founder of Delight Path (also a newsletter) and the author of the bestselling book Product-Led Onboarding. Prior to that, he worked at Appcues, a product adoption platform, and ProductLed with one of the pioneers of PLG, Wes Bush.
Today’s Post
We’re going to break down everything you need to know about onboarding metrics—focused on the advanced topics:
Speed-Run the Basics
Case Studies in Metrics
How to do it in Sales v Product Led
Common Mistakes that People Make
Whole Universe of Metrics
Mobilizing the Company
Brought to You By UserGuiding
Today’s post is completely free thanks to our sponsor UserGuiding. They have just completed a study of product adoption trends on over 500+ companies:

1. Speed-Run The Basics
The best way to measure activation today? Break it down into three actionable steps:
Setup: Users configure the feature so they’re ready to use it.
Aha: Users reach the magic moment where they see real value.
Habit: Users turn that magic moment into a recurring behavior.

This three-step framework avoids the trap of focusing on a single “activation moment” and instead tracks the full journey. But this understanding didn’t appear overnight—it’s the product of years of evolution.
The History of Activation
Phase 1 - From Facebook Comes Activation
The activation conversation started with Chamath Palihapitiya, Facebook’s former VP of Growth.
In his legendary 2013 Growth Hackers talk, Chamath revealed the secret to Facebook’s growth:
“Get any individual to 7 friends in 10 days.”
That was it. The entire activation playbook boiled down to a single formula.
Inspired by this simplicity, teams everywhere began searching for their own “X in Y days” metrics. But soon, cracks appeared.
Phase 2 - From Reforge Come Steps
The problem with trying to formulate an “X in Y days” metrics is that:
It isn’t applicable to all products.
It doesn’t capture the nuance of where people fell off along the journey.
It requires enough user data to formulate that early-stage startups or B2B companies don’t have.
So we added in these 3 steps of activation, which was mostly popularized by Reforge: Setup, Aha, and Habit.
This helped apply the model to a broader range of products and capture behavior better.
Now, we’re seeing the limits of this framework…
Phase 3 - Added Complexity
But as products became more complex, so did activation metrics.
Complex B2B products often blur the lines between Setup and Aha.
Multi-product companies need separate activation metrics for each product line.
The clean “three-step framework” can break down when real-world user behavior doesn’t fit neatly into stages.
This growing complexity is why activation metrics feel messy today—and why this piece exists.
Let’s untangle the chaos and dive into what really works.
2. Case Studies in Onboarding Evolution
Understanding activation frameworks is one thing. Applying them in the real world is another.
No framework—whether it’s “X in Y days” or Setup, Aha, and Habit—works perfectly out of the box. Companies constantly iterate and evolve their metrics as they uncover new insights, face growing complexity, and scale.
Let’s look at two real-world examples of how onboarding and activation frameworks have evolved in practice: Apollo.io and Appcues.
Case Study 1 - Apollo
At Apollo.io, three evolutions in our metrics really helped us:
Evolution 1 - Focus only on core users
At first, Apollo looked at all types of users - getting them to the aha moment of downloading 5 contacts. But we quickly realized this wasn’t helping us.
You see? Apollo was really focused on growing sales teams at funded companies. So instead of look at all personal emails and everything else… we only focused on what the activation rates were for paid core users.
This was a huge unlock - instead of focusing on free or non-core users, we narrowed the focus. That’s very important in activation. Otherwise you focus on user groups that don’t matter.
We focused on a product-level goal across our suite of products.
Evolution 2 - Sticking to constant metrics for a half
But we kept learning new things about these metrics. So they kept changing:
We started looking at downloading 5 contacts
Then we focused on downloading 5 contacts and sending a sequence
Then we adjusted it to the aha moment for any of our 2 products
The next really important evolution in our onboarding metrics was to stop evolving our metrics.
We stuck to a single key activation metric north star we wanted to drive - getting people to send a sequence. That was the product with the highest retention and cross-sell potential, so we got narrowed and focused.
This worked well. We actually made progress, instead of changing all the time.
Evolution 3 - Developing activation metrics by product line
The final evolution was for us to create a framework for each of Apollo’s products that had setup, aha, and habit moments.
This allowed us to focus in the core product teams and other teams within the business - like customer success - focus on progressing users through the three steps along each product.
It’s the inevitable progression for companies moving from single to multi product.
Case Study 2 - Appcues
Appcues’ onboarding evolution reveals a different challenge: how to balance automation, personalization, and speed.
Evolution 1 - Creating a self-serve experience for the core use case
In the initial phase, Appcues focused on developing a completely self-serve experience for their core use case—helping B2B companies onboard their users. This approach aimed to:
Provide users with autonomy in exploring the product through in-app flows and guides.
Reduce the need for human intervention in the onboarding process.
Give users the documentation and resources
We defined the aha moment as the first time Appcues users reaching their first user with a flow, experience, or message.
However, they soon realized that this approach had limitations, particularly for users who had other use cases other than onboarding.
Evolution 2 - Creating experiences for other use cases
Recognizing the diverse needs of their users, the Appcues team expanded their focus to create experiences for a variety of use cases beyond onboarding. This evolution involved:
Personalizing the experience for five of the most popular use cases.

Creating playbooks for various scenarios such as feature announcements, product updates, and user feedback collection.
Offering more flexibility in how users could implement Appcues for their specific needs.
This approach allowed Appcues to cater to a broader range of customers and use cases, increasing the overall value proposition of their product.
Evolution 3 - Optimizing for “Day 1” wins and human intervention
In their third evolution, Appcues shifted focus to creating immediate value for users and incorporating helpful human touchpoints.
One of the challenges for products like Appcues is that it could take days for users to experience the aha moment.
That’s because it may take time for users to implement Appcues on their own site, create flows, get approval to do a beta test, publish flows live, and see the results.
So in the next evolution included:
Focusing on getting users to a “Day 1” win. That’s a mini aha step that most users can do within the first day of signing up. For Appcues, that’s installing the builder and start designing a flow right away.
Prompting users along the onboarding that they can reach out to the team for help at any time. We found that users who talk to our team are 2 to 3 times more likely to activate sooner rather than later.

Developing a system to identify when users might benefit from human intervention, based on their behavior and progress.
This evolution aimed to strike a balance between automation and personalization, ensuring that users received the right level of support at the right time to maximize their chances of success with the product.
Bridging the Framework and Real World
These examples show that frameworks are starting points. Real success comes from iterating on metrics as user behavior and product complexity evolve.
Now that we’ve seen how companies apply and adapt onboarding metrics, let’s dive into actionable strategies for product-led vs. sales-led activation and the common mistakes to avoid.
Did you know that 74% of companies use segmentation in onboarding? It’s a really common design pattern.

You can get that insight and more in UserGuiding’s free ebook on Adoption Trends.
3. How Activation Works in a Product-Led vs. Sales-Led Company

For product-led companies, the focus is on creating intuitive, self-serve experiences that guide users to value quickly (i.e., the Aha moment). For example, Duolingo uses gamification extensively with streaks, leaderboards, and rewards to keep users engaged in language learning.
Their activation metrics focus on completing the first lesson and maintaining a 5-day streak.
In contrast, sales-led companies typically employ high-touch onboarding strategiet including:
Dedicated customer success managers
Personalized onboarding calls and demos
Custom implementation plans
Regular check-ins and progress reviews
Training sessions for key stakeholders
Detailed documentation and playbooks
For example, Salesforce assigns dedicated account executives who create customized onboarding plans based on each client's needs.
They focus on training key admin users first, then gradually roll out features across teams.
So, their activation metrics typically revolve around admin setup completion, user adoption rates, and custom report creation.
Free vs. Paid Activation

One of the most interesting topics in activation for PLG companies is activation of your free users vs your paid users.
As we said with the Apollo example, we didn’t actually end up focusing on them too much.
Free users can be a distraction. You should consider measuring them separately.
Paying users have more “skin in the game” since they’re paying for your product. As such, you can invest time and resources to set them up for long-term success.
4. Common mistakes that people make
Mistake 1 - Not checking that Aha metrics influence retention

At thredUP, we made a classic mistake early on: focusing on the wrong activation metric.
We zeroed in on "add to cart" as our key Aha moment. It seemed logical—adding an item to the cart felt like a meaningful step in the user journey.
But over time, the data told a different story. Users who added to their cart weren’t necessarily the ones who stuck around. They weren’t exploring the full value of the platform or setting themselves up for repeat purchases.
We dug deeper and realized something important. Users who took the time to input their size and preferences were far more likely to make a second and third purchase. Why? Because they’d tailored the experience to their needs. They weren’t just interacting—they were committing.
This shift in focus taught us a critical lesson: activation metrics must connect directly to retention. If they don’t, you risk optimizing for a behavior that doesn’t lead to long-term success.
Retention is the real game. The best activation metrics aren’t just about the first moment of value. They’re about creating a foundation for ongoing engagement.
Mistake 2 - Constantly changing
As you learn more about your product, and as your analysts get cranking, as your researchers start learning more… everyone evolves what they think activation is.
And this is a double problem as soon as you start working activation, because you get really smart people studying the problem in-depth.
So the temptation is: “okay, we learned this new aha moment.” Let’s pivot thing to every focus on that.
The problem is: pivoting really throws the team off.
You think it’s the most important thing at the time.
But they’re will always be another most important thing that you’ll learn.
So it’s usually better to stick to something for a quarter, because that allows the engineers, the designers who might not be as close to these new revelation to actually go out there and build and move metrics.
Aakash personally has had the problem where he let his team change the metrics and they ultimately ended up not moving any metrics that quarter.
And that’s a huge cost the company. If you think about it, that team, let’s say they all make $200K and there’s 8 of them, then you but just burned $400K not moving metrics. And there’s thing Goodhart’s Law: once a metric is goaled, it ceases to be useful.
So there’s always gonna be another better metric, and for short periods, you just have to commit.
Mistake 3 - There’s a limit to what product can do
When you acquire users who don't fit your product's ideal customer profile, they're less likely to activate and succeed.
These mismatched users often require more support, have lower satisfaction rates, and churn quickly. Focus on attracting users who align with your product's core value proposition.
This means understanding your target audience deeply, refining marketing messages, and qualifying leads effectively before they enter your funnel. Quality of acquisition directly impacts activation success.
We suggest you segment your activation rates by acquisition channels:
Social channels (Facebook, Instagram, etc.)
Paid channels (Google Ads, Facebook Ads, etc.)
Organic channels (Google, Bing, etc.)
Referrals (podcasts, backlinks, word-of-mouth, etc.)
Outbound channels (cold emails, LinkedIn DMs, etc.)
By analyzing these segments, you can identify which channels bring in users most likely to activate. Often, organic and referral channels yield higher activation rates than paid acquisition. This insight helps optimize marketing spend and improve overall activation metrics.
For a B2B company that RJ worked with, the activation rates for users from Facebook and Instagram activated up to three times lower than organic channels.
This kind of analysis often requires product teams to work with someone from Marketing Ops. This leads us to the final activation mistake…
Mistake 4 - Lacking org-wide buy-in that the metrics are the one’s to use and are important to work on
Activation isn’t just a product problem. Without alignment, teams optimize for conflicting goals, creating a fragmented experience.
At Appcues, marketing owned emails, product owned in-app onboarding, and customer success owned high-touch processes. The result? A disjointed experience that confused users.
Align teams around shared activation metrics. Cross-functional collaboration ensures the onboarding experience feels seamless and drives retention.
5. The onboarding metrics universe
As you’ve understood by now, no single metric matters. It’s about evolving to your system.
But what is the full universe of metrics you might consider?
Here’s your laundry list:

1 - The Signup Step
Signup Conversion Rate: The percentage of visitors who complete the signup process.
Time to Complete Signup: How long it takes users to finish the signup process.
Signup Abandonment Rate: The percentage of users who start but don't complete the signup process.
Form Field Completion Rate: Which fields users fill out and which they skip during signup.
2 - The Setup Step:
Account Setup Completion Rate : Percentage of users who finish initial account configuration.
Time-to-Complete-Setup: The average duration of users to finish setting up their account.
Setup Dropoff Rate: The percentage of users who drop off from setting up their account.
3 - The Aha Step
Time-to-First-Value: How long it takes for users to experience the first value moment of your product. This is the user’s first “quick win.”
Time-to-Full-Value: How long it takes for users to experience the full value of your product. For B2B companies like Amplitude or Appcues, this could take several days because it requires implementing a code snippet and getting data. For simple products, the Time-to-First-Value could be the same as the Time-to-Full-Value.
Feature Adoption Rate: The percentage of users who engage with key features during onboarding.
Onboarding Completion Rate: The percentage of users who finish the entire onboarding process. Note that some users will complete all the onboarding step but don’t activate. For example, at Appcues, the final onboarding step is to launch a flow. But if it’s not setup properly, they won’t.
User Activation Rate: The percentage of users who take a specific action that indicates they've found value in your product.
4. Habit Step
Daily/Weekly/Monthly Active Users (DAU/WAU/MAU): The number of unique users who engage with your product over different time periods.
Retention Rate: The percentage of users who return to your product over time.
Churn Rate: The percentage of users who stop using your product over a given period.
Feature Usage Frequency: How often users engage with specific features of your product.
What matters most is your approach
Generally, the best approach is not to set OKRs against 5 of these. Choose a north-star and move that. Then have others as secondary and guardrail metrics.
6. How to get your whole company mobilized around these metrics
Product doesn’t do all the work - especially in B2B SaaS.
In fact, if only one department could be relied on, customer success is gonna have the most impact.
And that’s because they are looking at the account health dashboard after signing.
So they can see okay in X account we have 30% of users not activated vs another is 70% so I’m gonna spend time with that 70% account to get them all activated.
Versus the product, it’s just gonna make broad changes to the whole product so you’re gonna have less ability to do targeted interventions in clients that aren’t hurting your activation metrics.
Example of Apollo - OKRs for Customer Success, Marketing
We made it one of our top 3 company level OKRs.
Then we gave each department - specifically marketing, customer success, support, and sales goals along it.
Then we helped them create the playbook for how they can influence it.
The result? We were able to double activation in 12 months (while increasing scale of users >3x).
Example with Appcues - Activation Tiger Team
At Appcues, the leadership team formed a cross-functional team focused solely on improving activation metrics. This "Tiger Team" included members from Product, Engineering, Customer Success, and Marketing. They met bi-weekly to review data, identify bottlenecks, and implement solutions.
The team's collaborative approach led to several key improvements:
Streamlined onboarding flows.
Better documentation and help resources.
More targeted customer outreach.
Personalized and enhanced product tutorials.
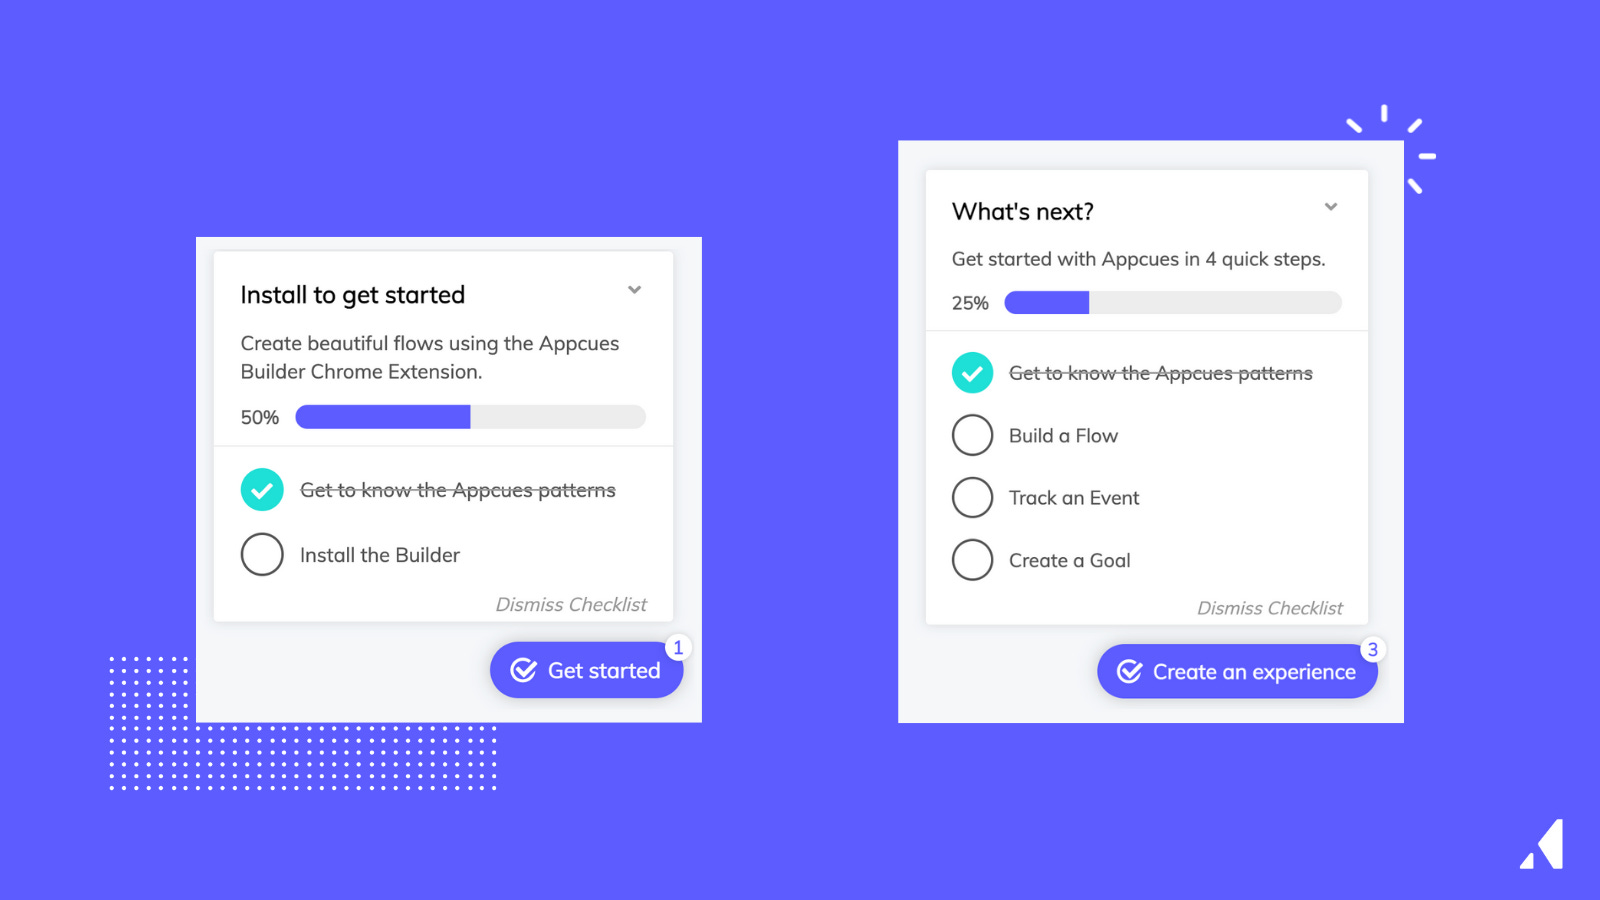
One such effort resulted in double-digit gains for their activation rate (from less than 2% to 25%) by breaking down their onboarding into bite-sized steps:
Today’s post was brought to you by UserGuiding. Check out their full ebook for more insights on User Adoption Trends like these:

Final Words
The magic isn't in finding the perfect metric. It's in building an organization that can consistently execute against the metrics you choose.
Most companies get stuck in analysis paralysis or chase every new insight. But the winners?
They pick their north star metrics and give the system time to work.
Additional Resources
Up Next
Thanks for reading that deep dive with Ramli John. I’ll continue to bring you collabs with experts who I think can move the needle!
I hope you enjoyed the last deep dive on How to Empower Teams in 2024 - Product Management in the era of Founder Mode with Eugene Segal as well.
We have the following newsletters coming up:
How to Write an AI PM Resume
How to Catch and Fix Issues Before Users Notice
The Google PM Interview Guide
And on the podcast, we have: Andrew Capland, Ramli John, and Ben Williams.
I look forward to sharing it all with you,
Aakash
P.S. If you’d like to earn free months of the paid version of product growth, refer your friends:
 |
|